
Oracle BICS DITL Part 01

An old photo of her storefront (it looks a bit more decorative now)
Red Pill Analytics recently purchased a license for the Oracle BI Cloud Service (BICS), and with our account being activated, I thought I’d take it for a spin. But rather than write a garden-variety series of how-to articles, I thought I’d give you a first-hand look, or a day-in-the-life (DITL) experience of what it was like for me to build several applications using a variety of data sources. What that means is that you get to watch me figure this stuff out as I write, rather than write this perfect, everything-is-easy article that basically tells you nothing meaningful. That means you’ll see me get errors, make mistakes, make poor decisions, and even do things in a sub-optimal fashion. The goal, of course, will be to work past them and gain a better understanding of what to do next time. Ready? Here we go…
For those who don’t know me well, my wife owns and runs a store in my town. Her store is called Lulu Bea’s and it sells hand-crafted items made from repurposed materials (called “upcycling”). She doesn’t make everything herself, but rather features other local artists alongside her own work. She also teaches classes and hosts parties for adults and kids at the store. If you want to learn more, you can visit her website at www.lulubeas.com.
My wife uses Square for her point-of-sale (POS) system. A simple iPad with a credit card reader is her cash register, and all of her sales transactions are recorded and saved in Square’s cloud-based SaaS. For my first trial with BICS, I thought I’d grab her raw sales data and uploaded it into BICS. Here’s where I ran into real-world challenge #1: Square only lets you export a year’s worth of data at a time, so I had to generate three csv files. How easily can I upload three files into BICS?
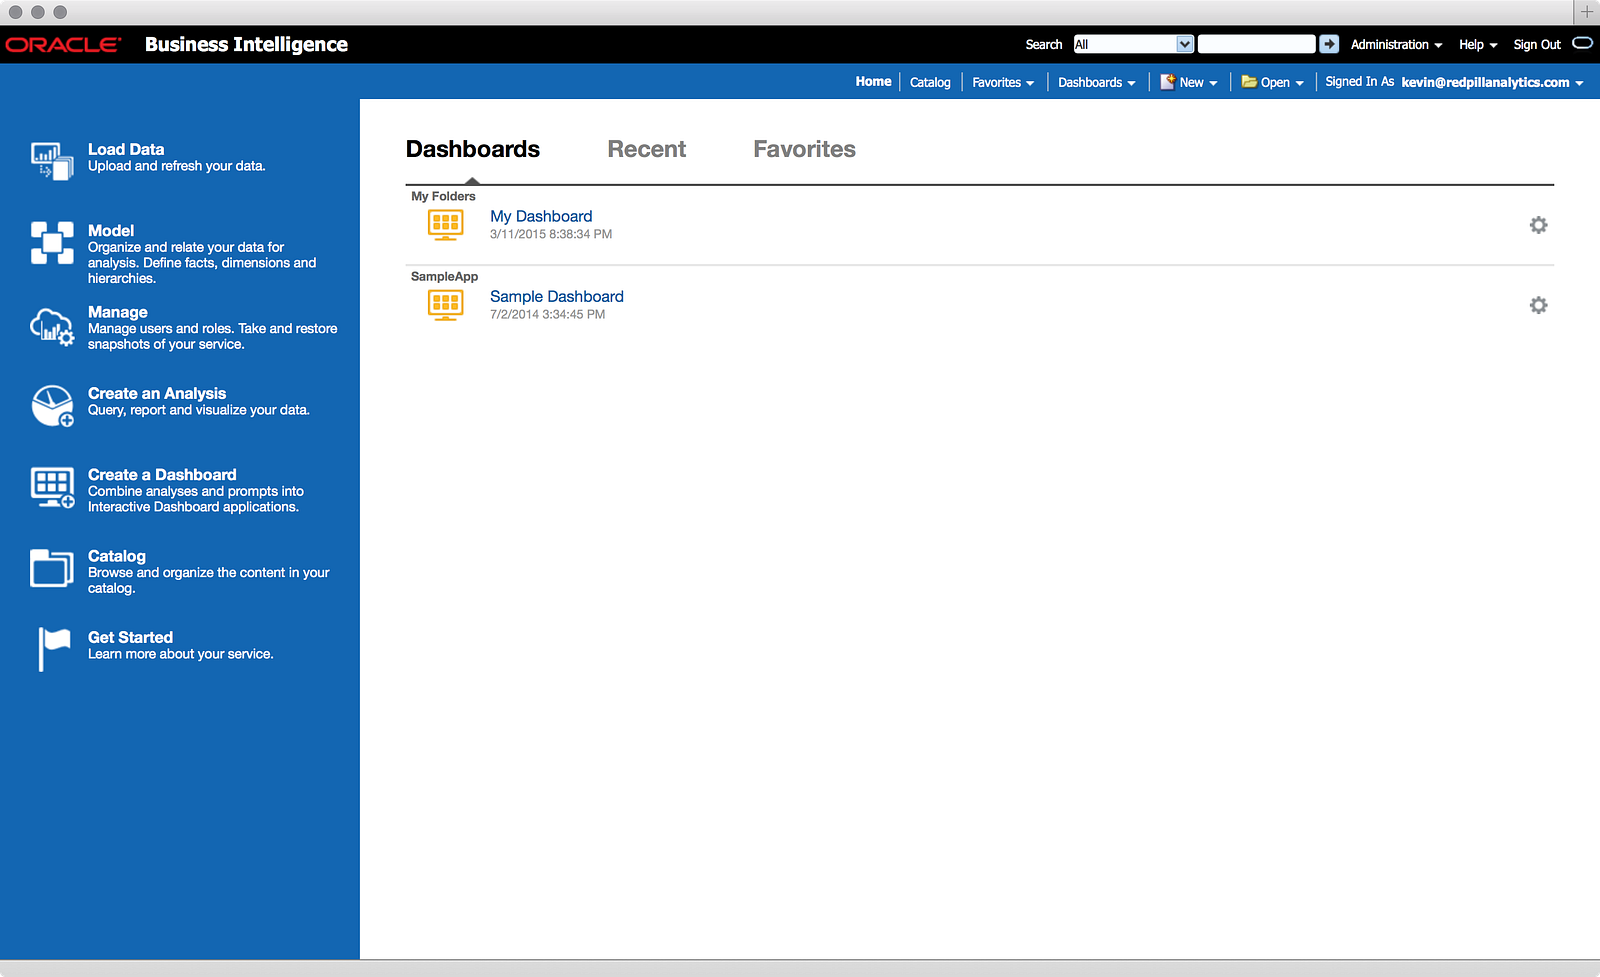
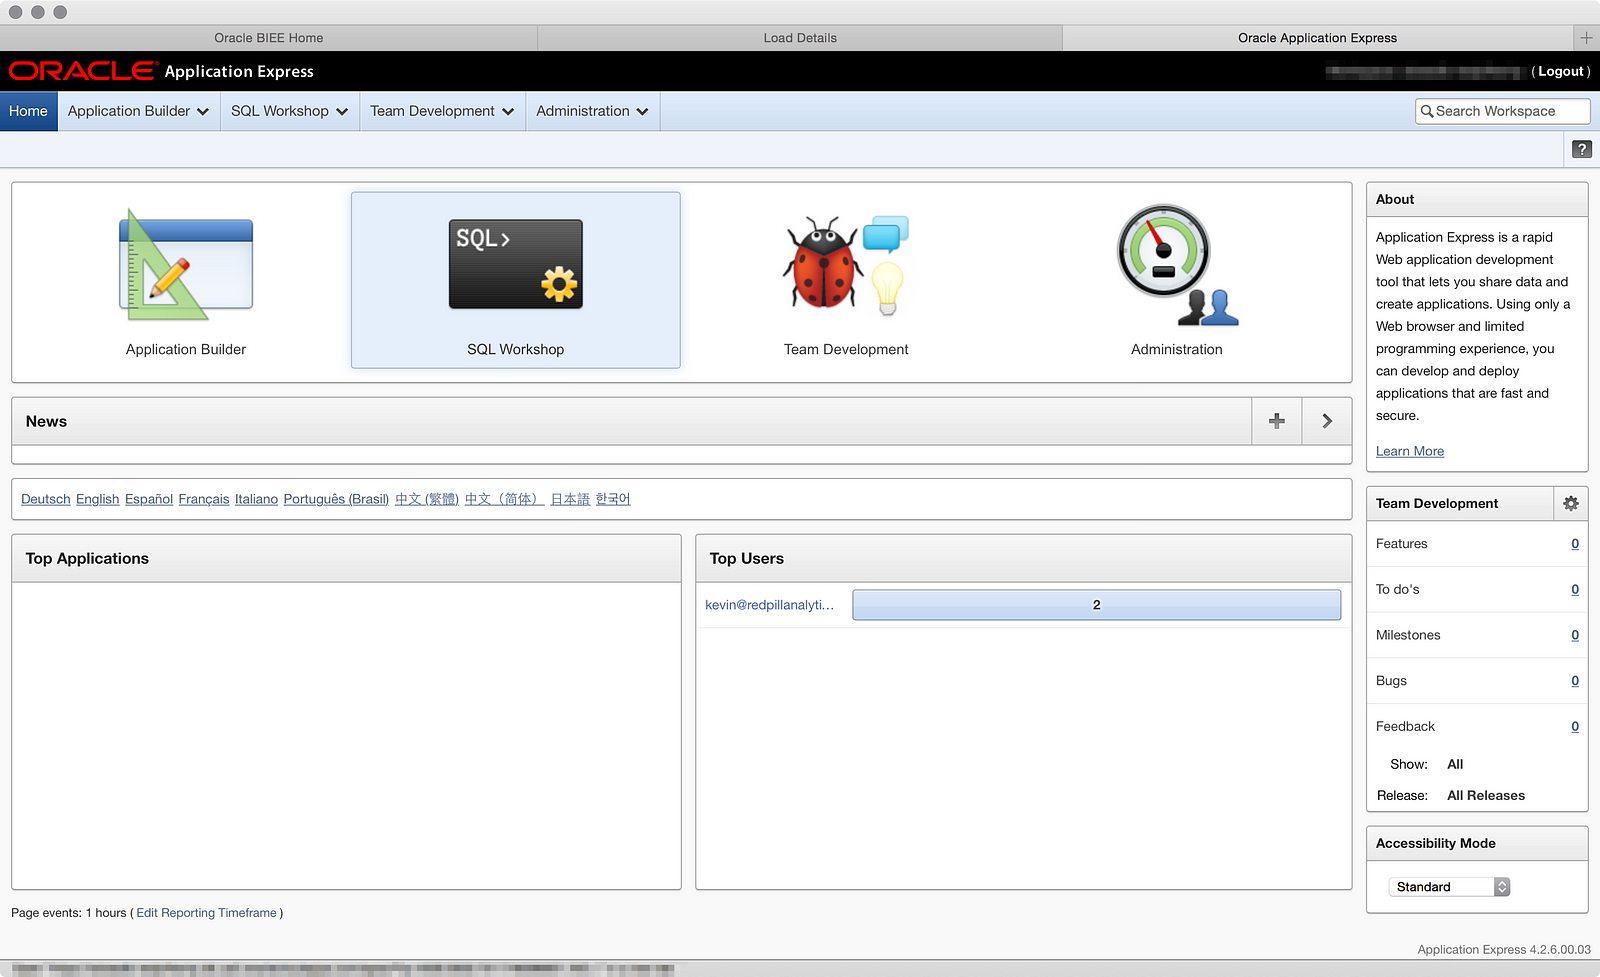
Well, first we need to start with 1 file, and to get that going, I had to start from the Home page of OBIEE, which looks a little different in BICS:
You launch the data loader using the (duh!) Load Data option on the menu bar on the left-hand side. This opens a window in another tab:
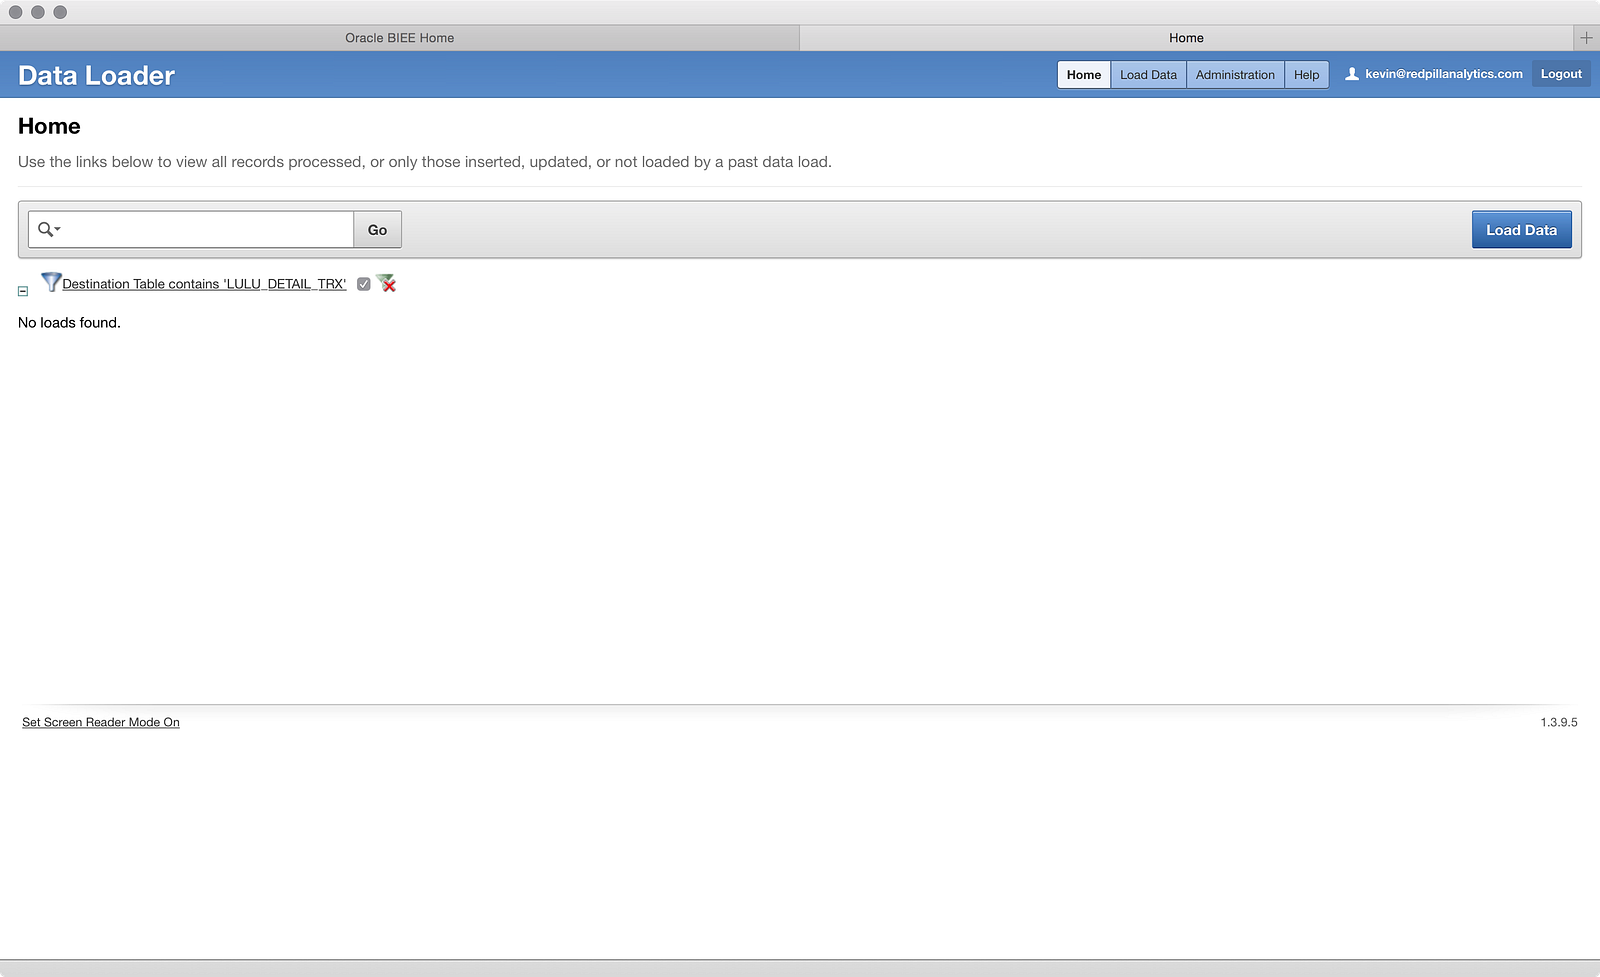
Full confession before we get too far: I did play around a bit before capturing screenshots, and I couldn’t figure out a way to delete that activity, so I applied a filter using the search bar at the top of the screen to hide it. The filter only shows the loads to a table I haven’t created yet. Got it? Great, now let’s click the big blue Load Data button (very intuitive so far):
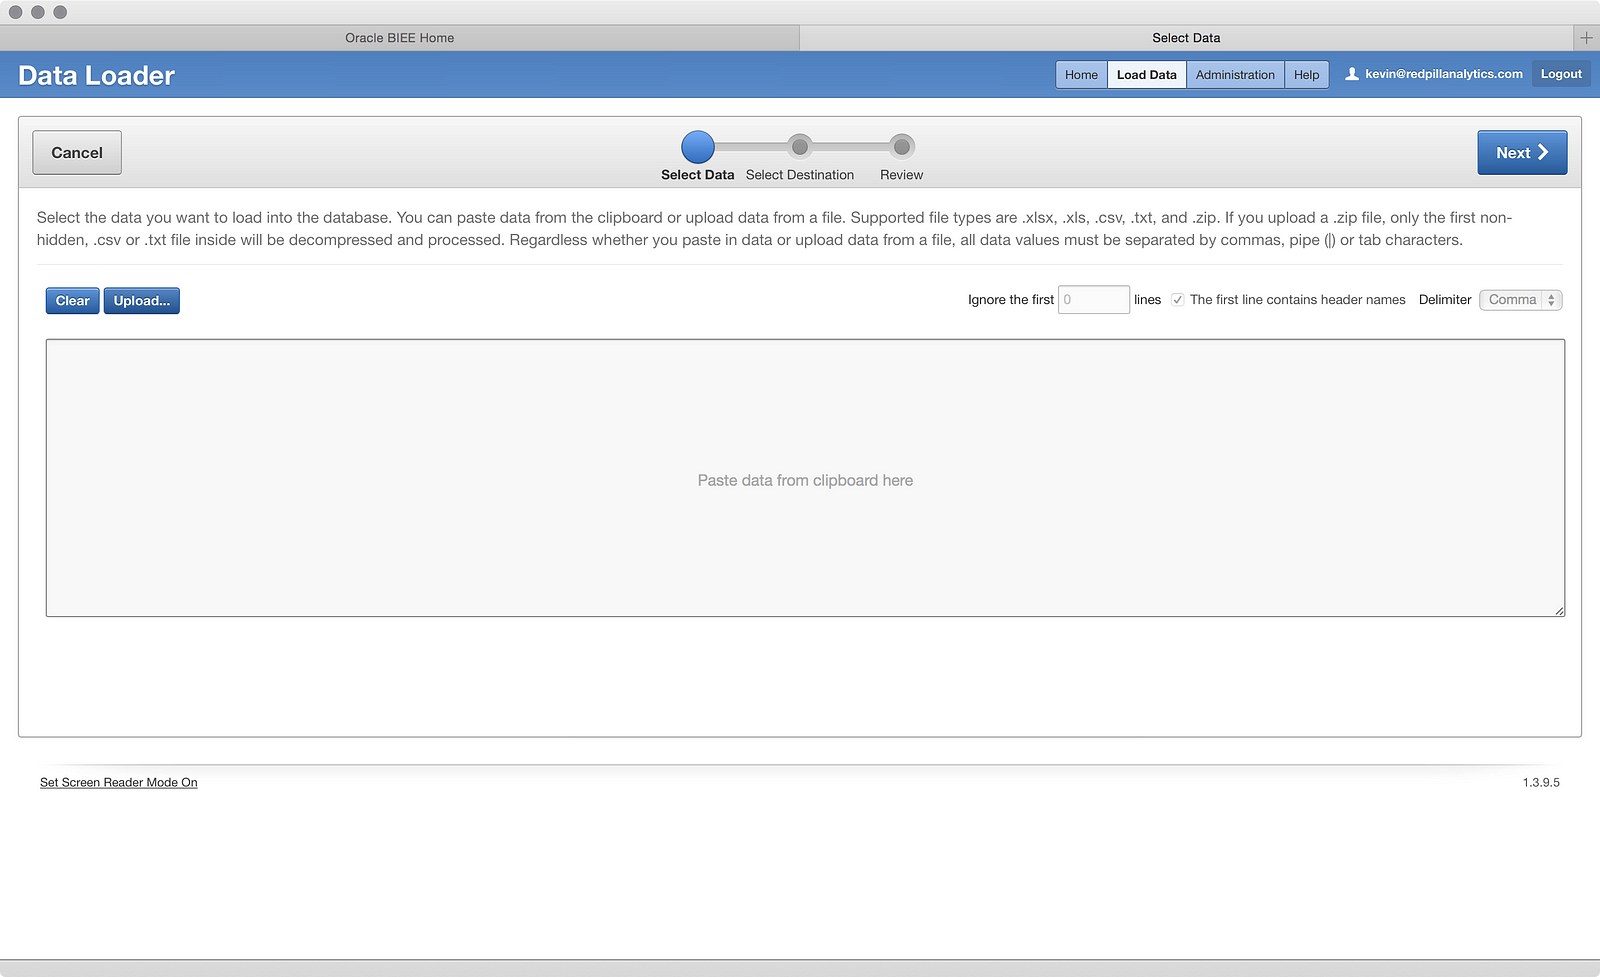
Now we’re launched into a wizard, and it looks like my two options are to upload a file or paste some data from the clipboard. I’ll choose the former and click the Upload… button:
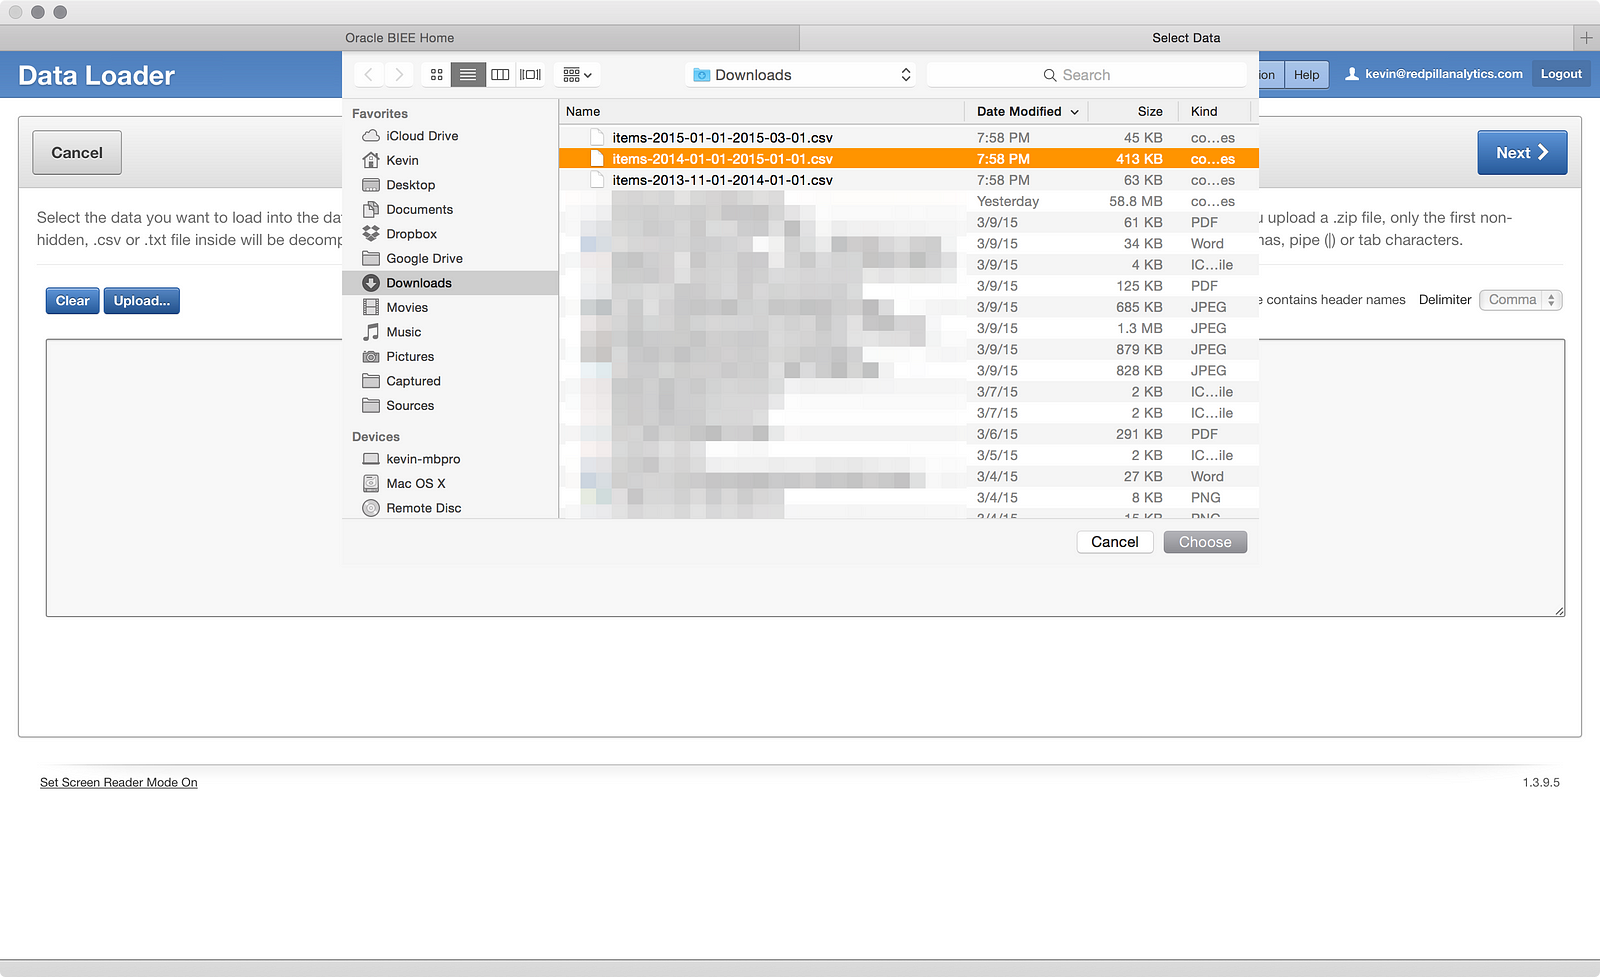
As you’d expect, you can choose a file from your computer to upload. In the screenshot, you can see my three files: a full year of 2014, two months of 2013, and two months of 2015. I’m going to start with the full year of 2014 file and then I get this screen:
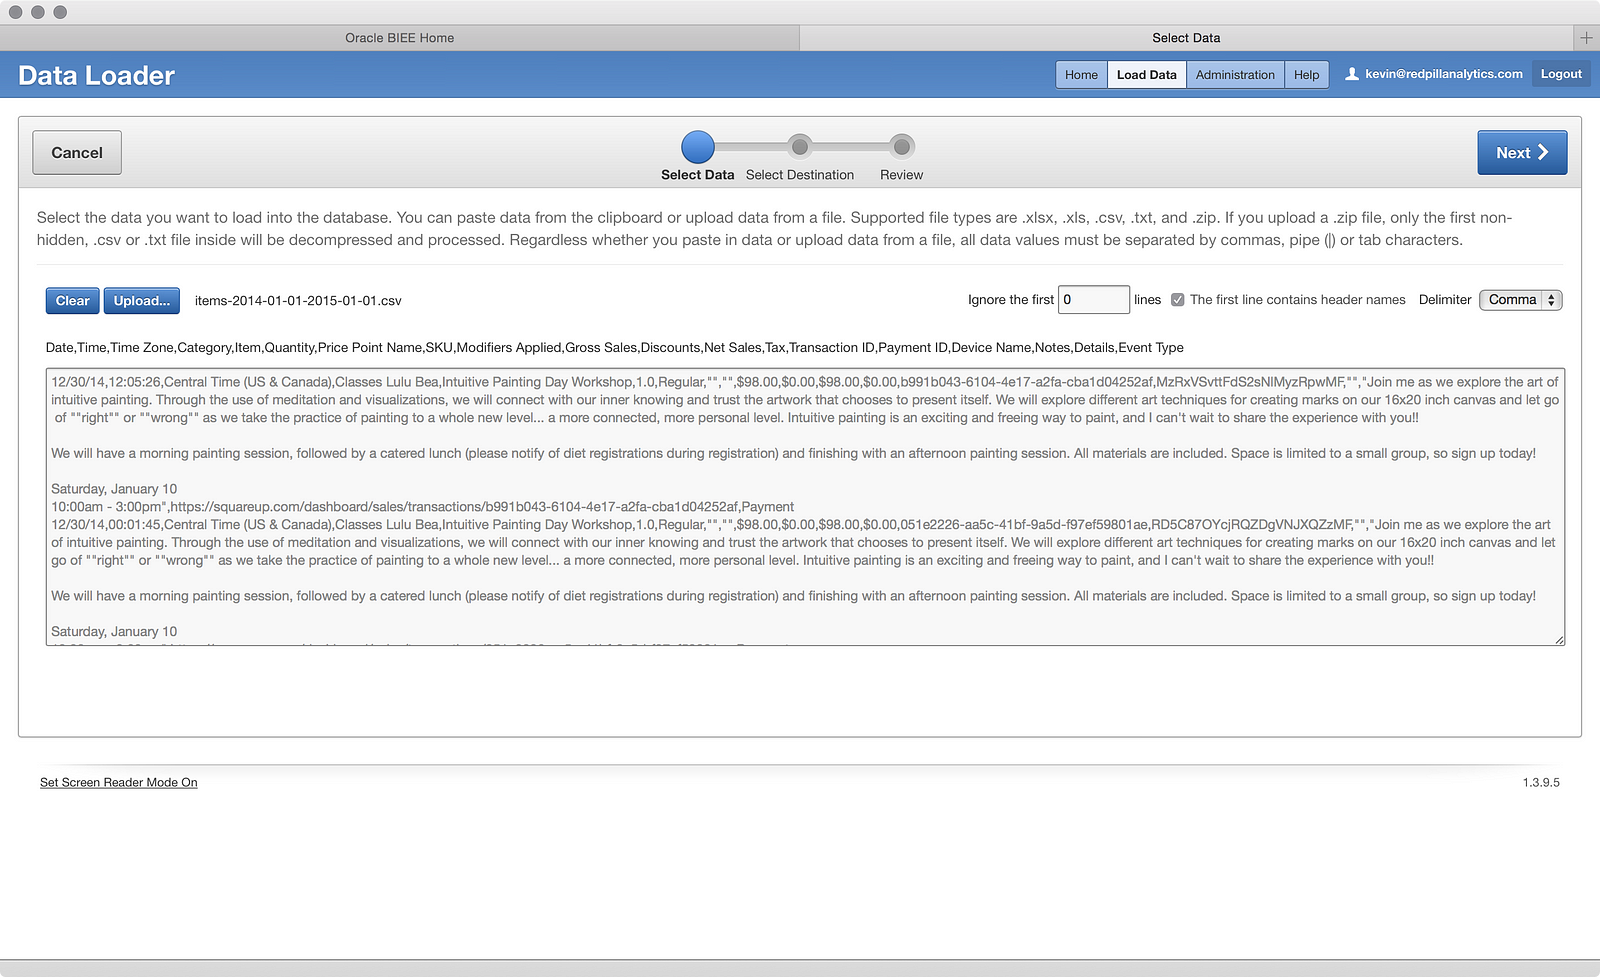
Looks a little unreadable, but I see that it wants me to set things like header rows, what kind of delimiter, etc. I also see all of the columns listed. It’s not the most beautiful view of the data, but it works. If I click the big blue Nextbutton, I get this:

Now we’re getting somewhere. I can’t see all the data here, but I can see the columns, some sample data, I can perform some light transformations, name the columns, and select the column types/sizes. I can also choose whether to load this into an existing table or create a new table, which is what I’ll do (LULU_DETAIL_TRX). Things look relatively OK here, so I’ll scroll down:
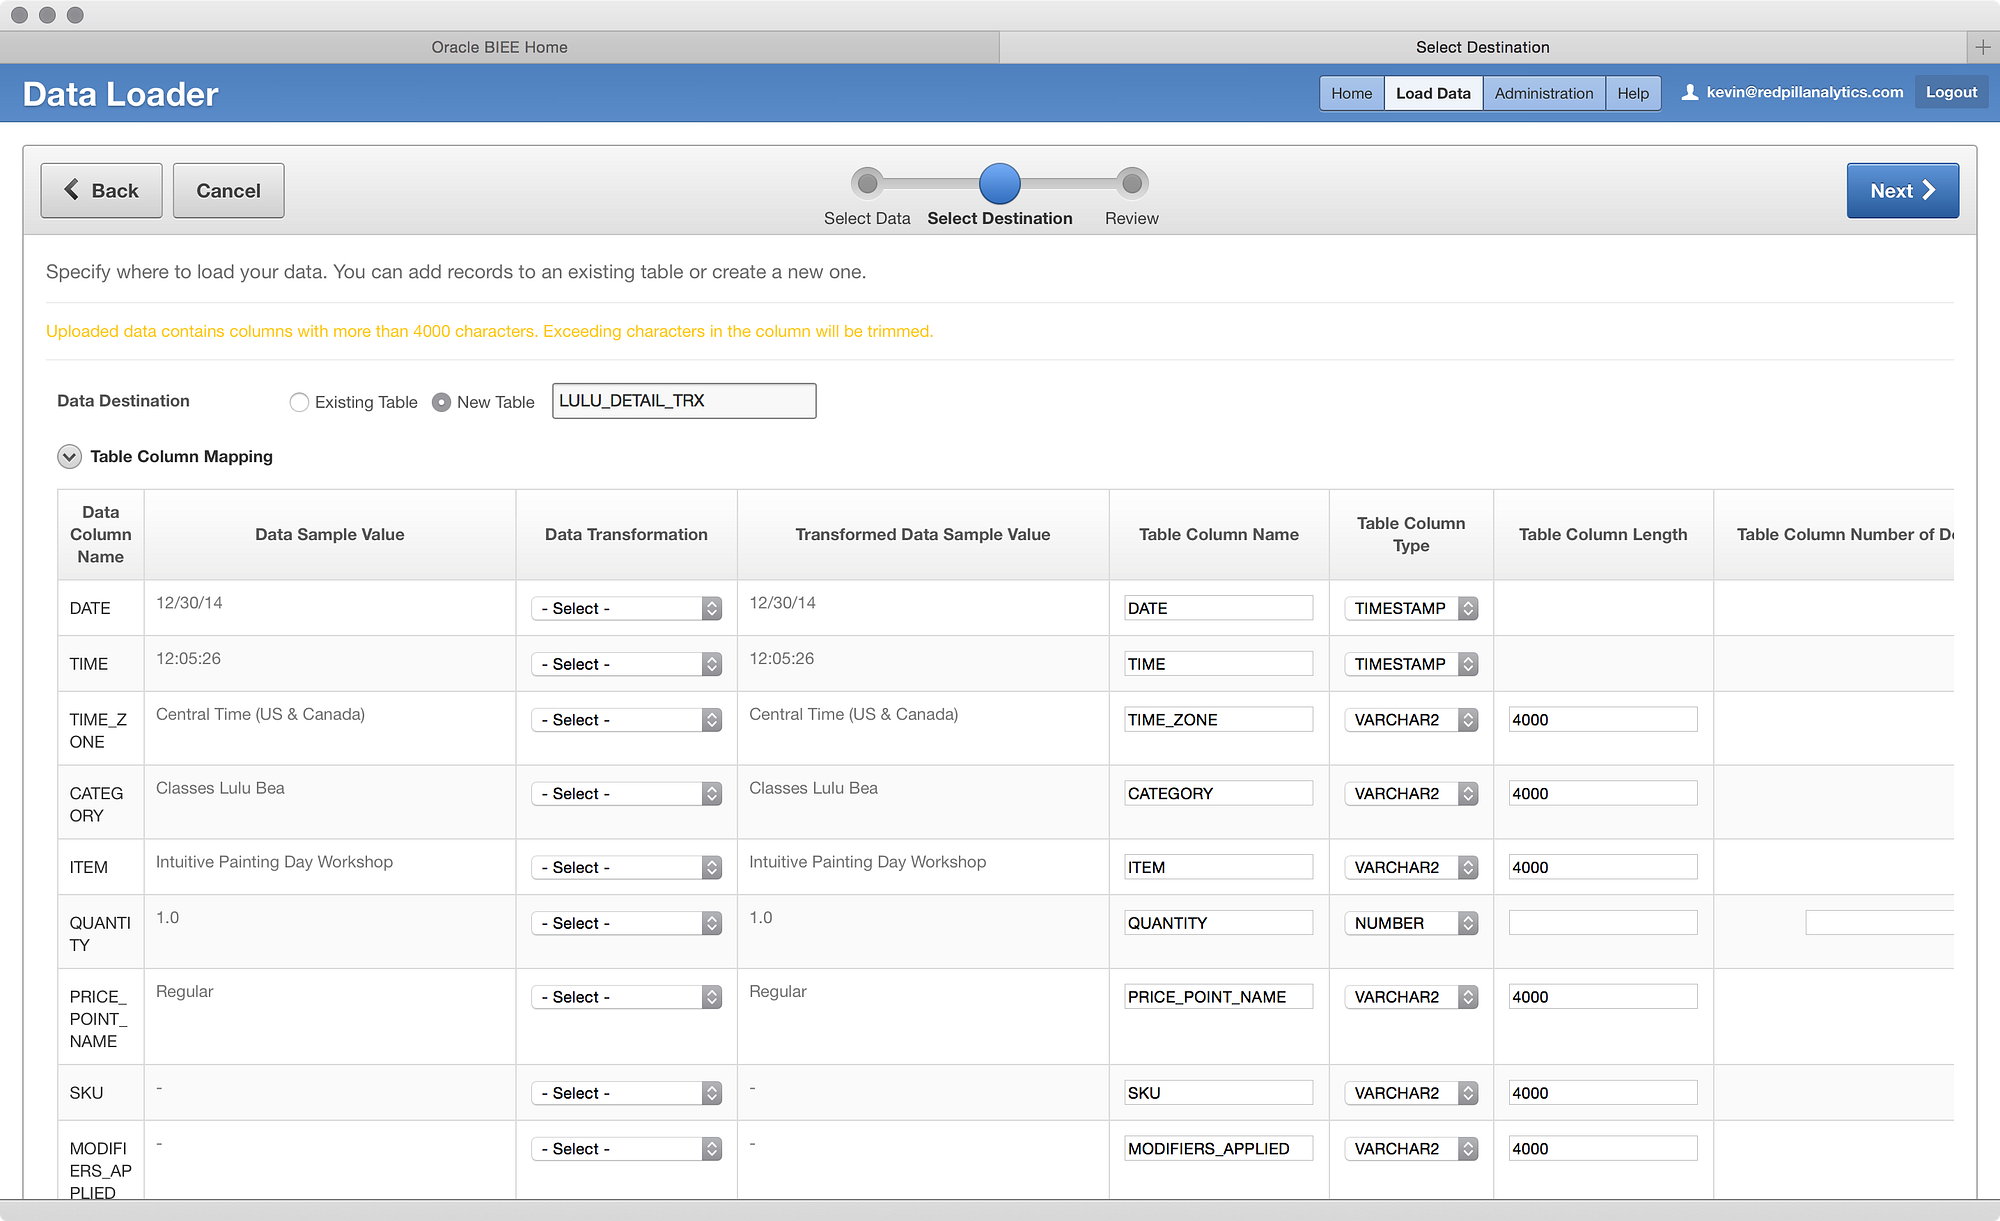
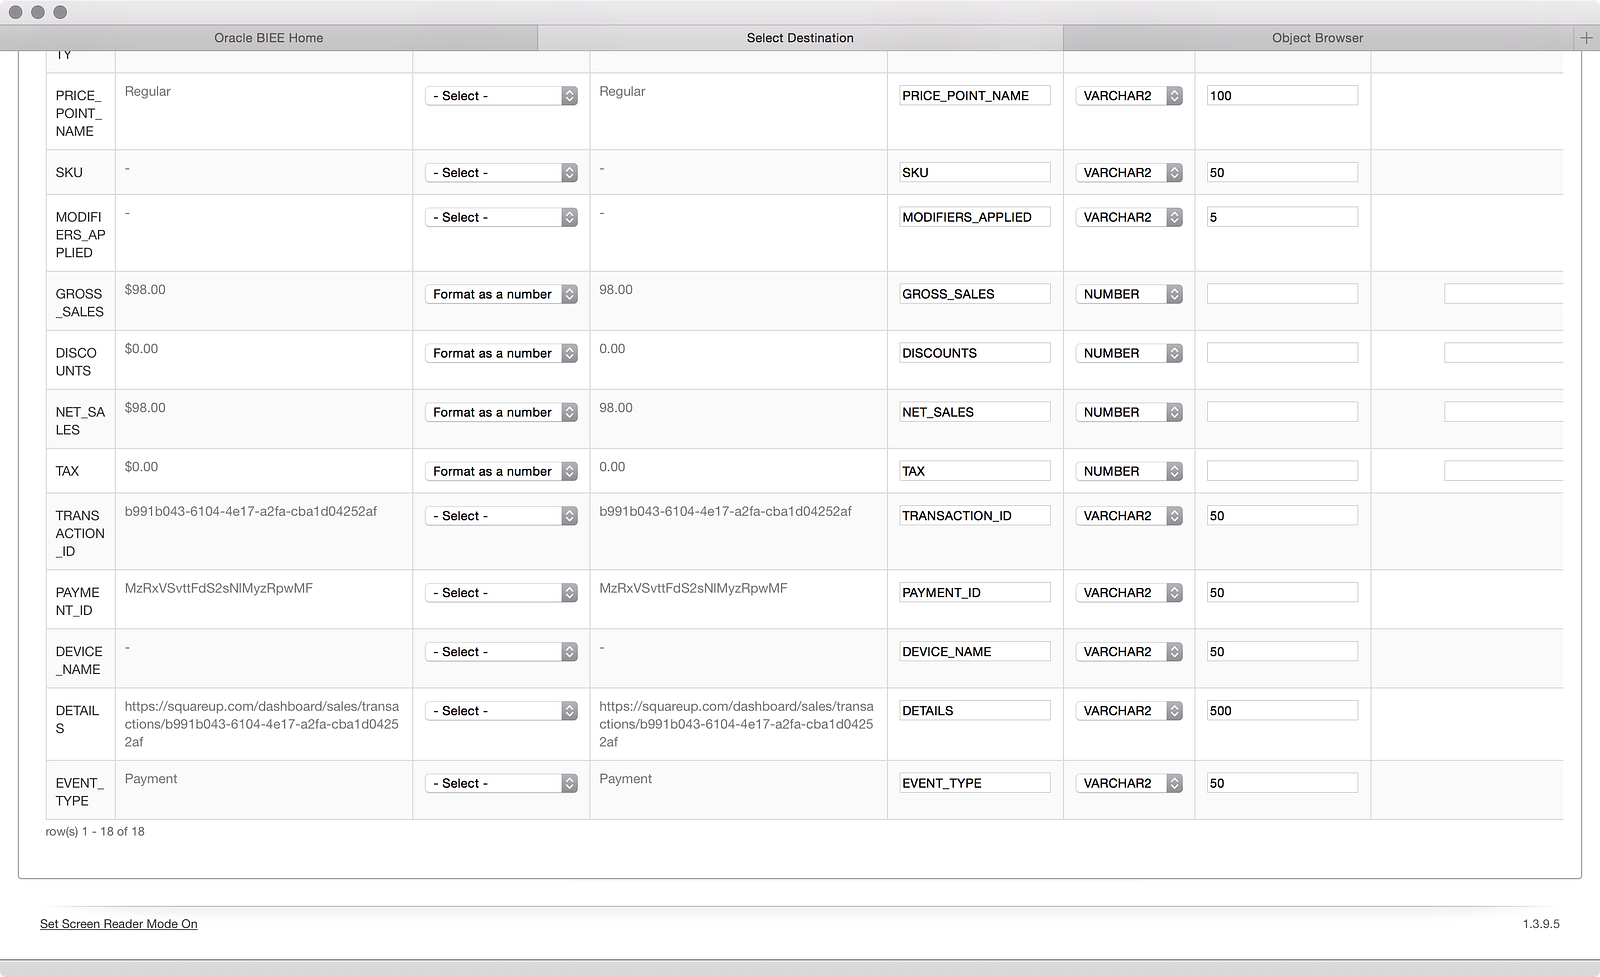
Now I can see the rest of the columns and I already see my first problem. Square outputs the dollar amounts with a dollar sign in the data, which makes the data loader think the data is text. I know I will want to do some aggregation on these numbers, so I need to change them to numbers. Fortunately, the data loader can help me out:
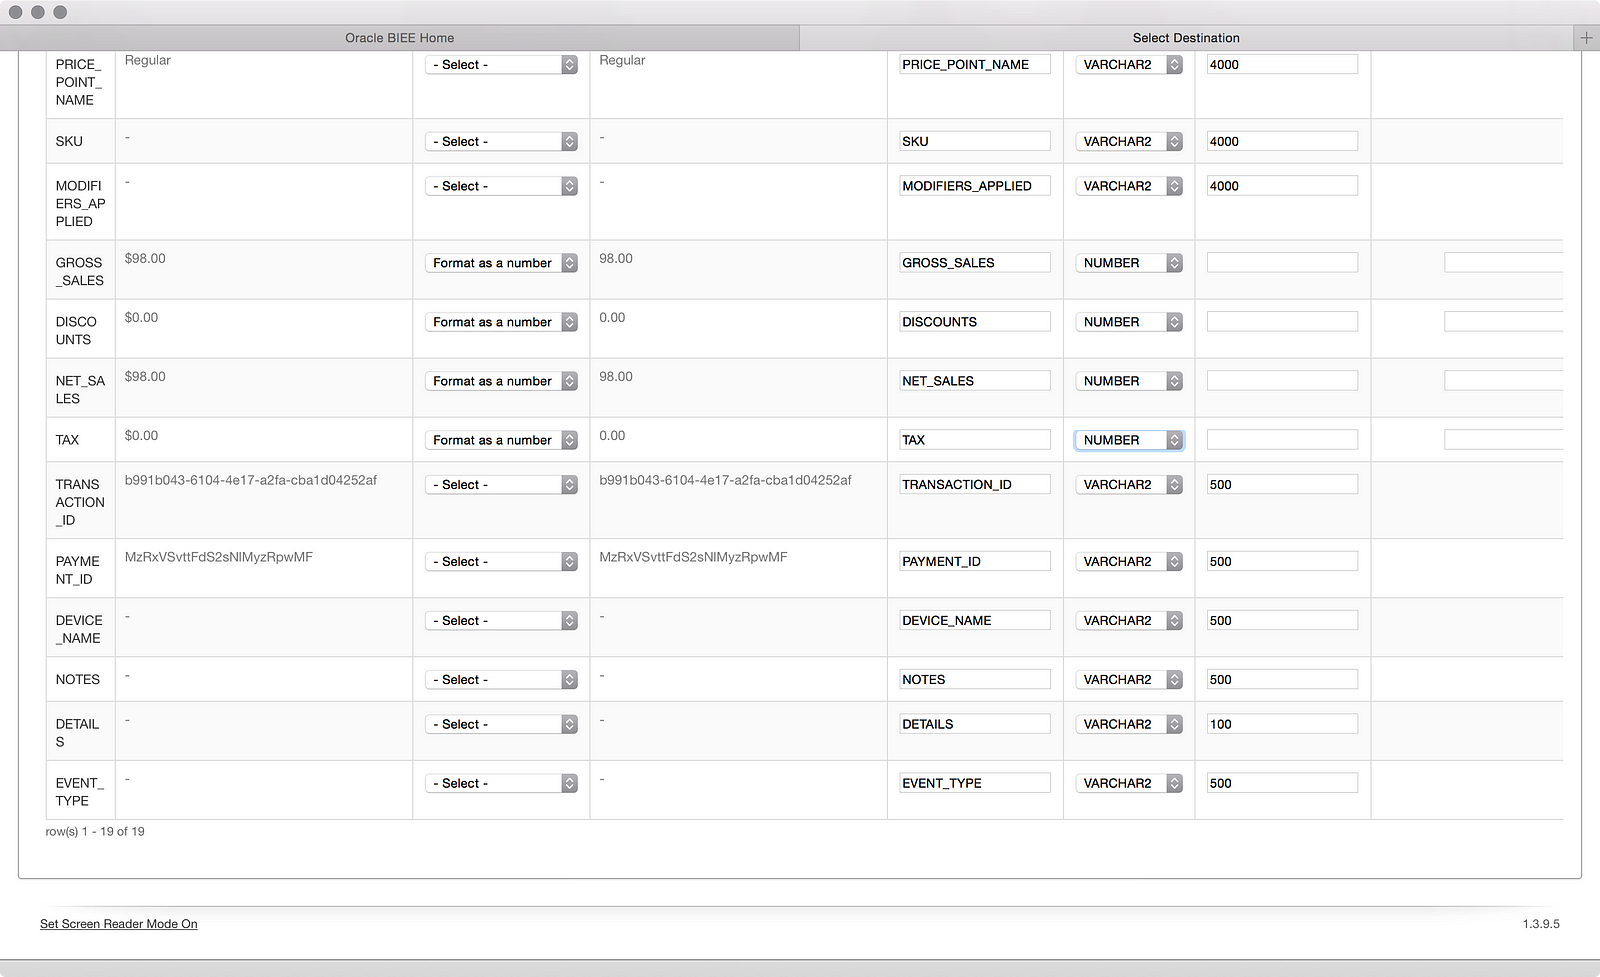
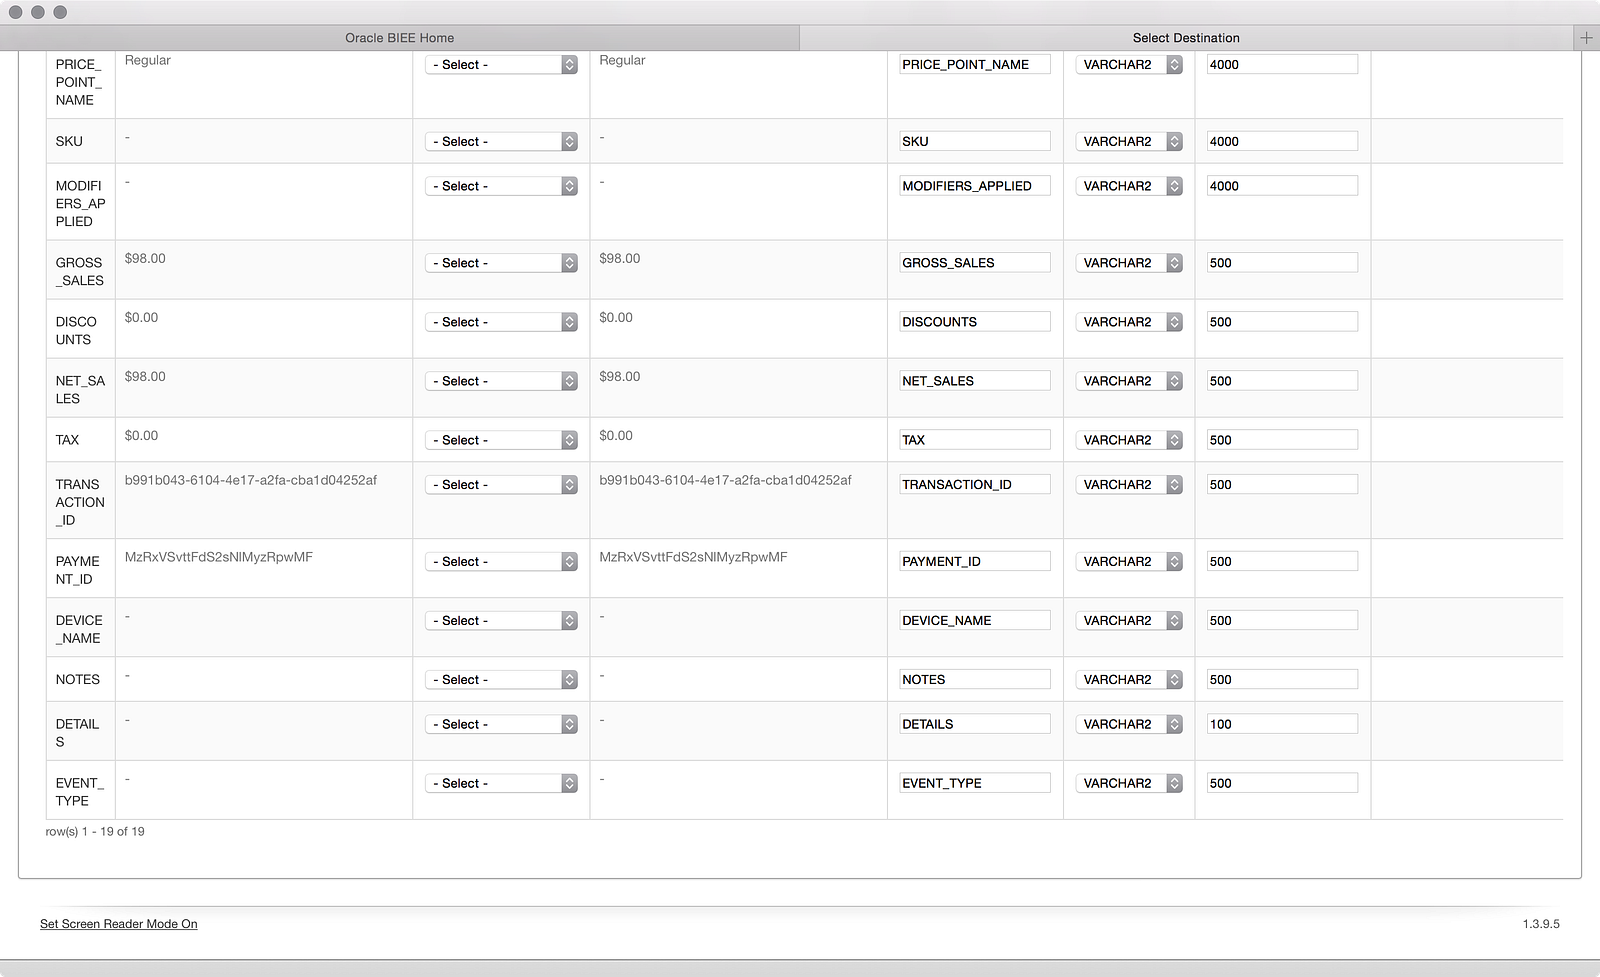
It won’t win any ETL awards, but at least the Data Transformation column dropdown has an option to convert text numbers to real numbers. I only wish it automatically changed the data type to ‘NUMBER’ as you select it; I had to change that manually. I also made a few manual changes to some of the VARCHAR2 sizes to make sure I have enough room. You can’t see in the above screenshot, but there is another big blue Next button at the top of screen, which leads me to this:
Ugh. Buzz-kill right out the gate. Something is screwy with Square’s file delimiter, because I can tell that columns are bleeding into other columns. My guess is that my wife uses double-quotes or commas somewhere in the fields. A quick analysis shows me the culprit:
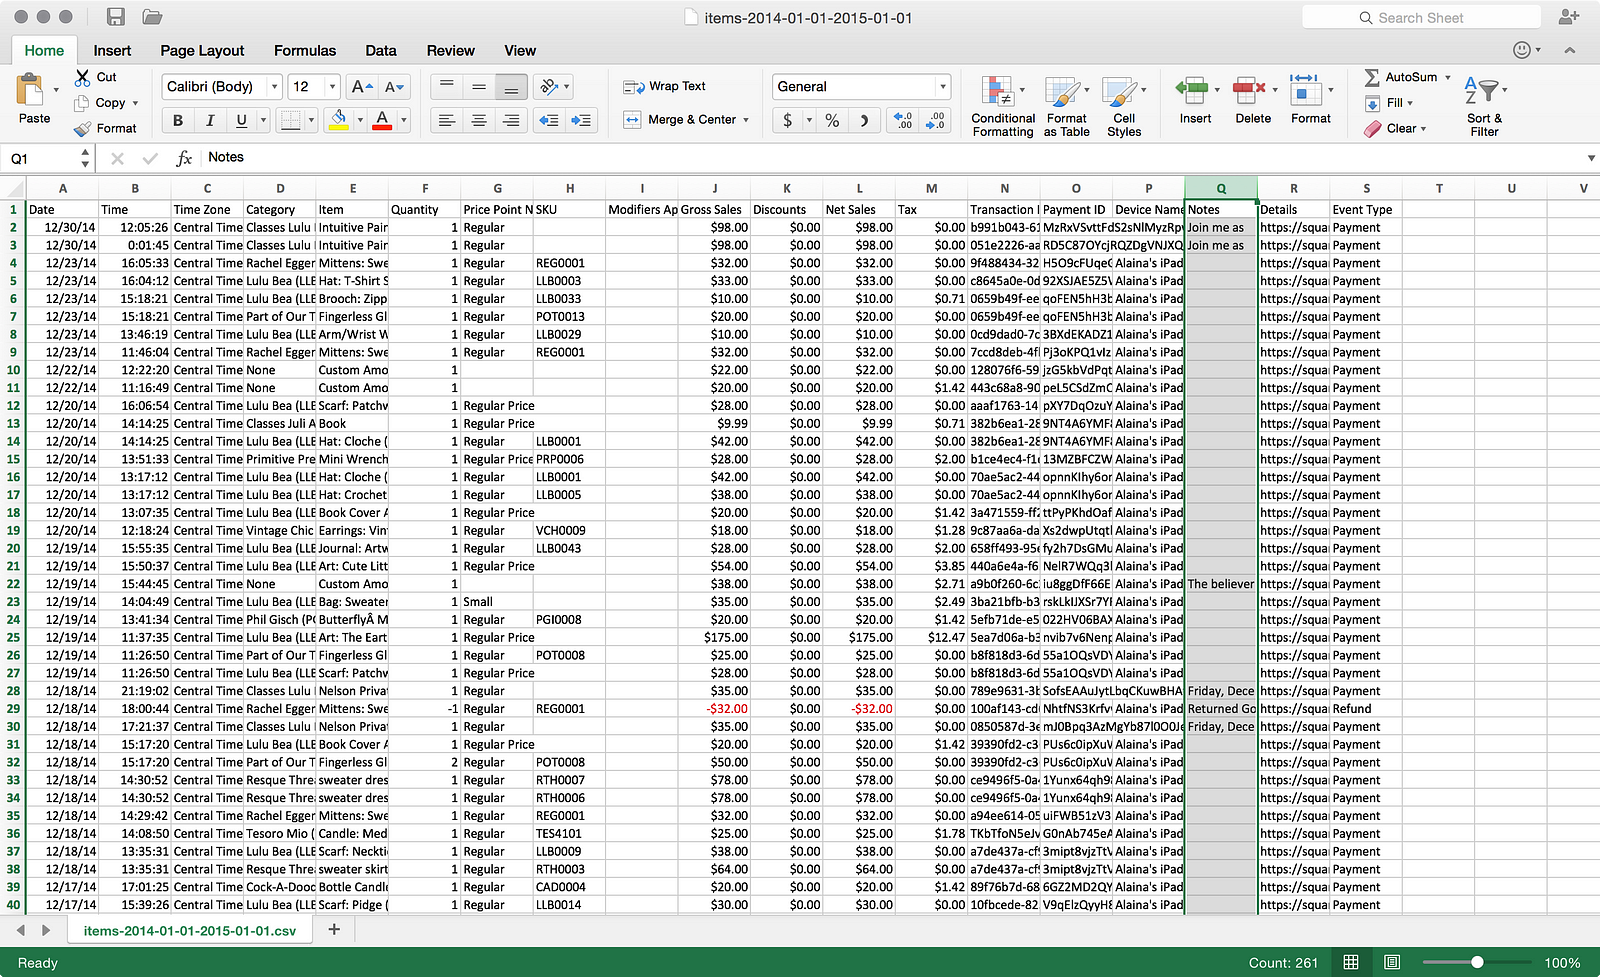
There is a free text column in the file that for some rows has large chunks of text. While there may be something useful in this data, I probably won’t be analyzing it with Oracle BI (EID, maybe?), so I’m going to delete the column from the file. What’s a little bit of a bummer here is that I couldn’t find any way in the original import to ignore the ‘Notes’ column, which would’ve saved me from having to edit my file. It’s not a horrible edit to make, but it does make me wonder what other data quirks I’m going to encounter and whether I’ll be able to ignore those or if I’ll have to fix them first. Data quality never goes away, even in self-service. Moving on…
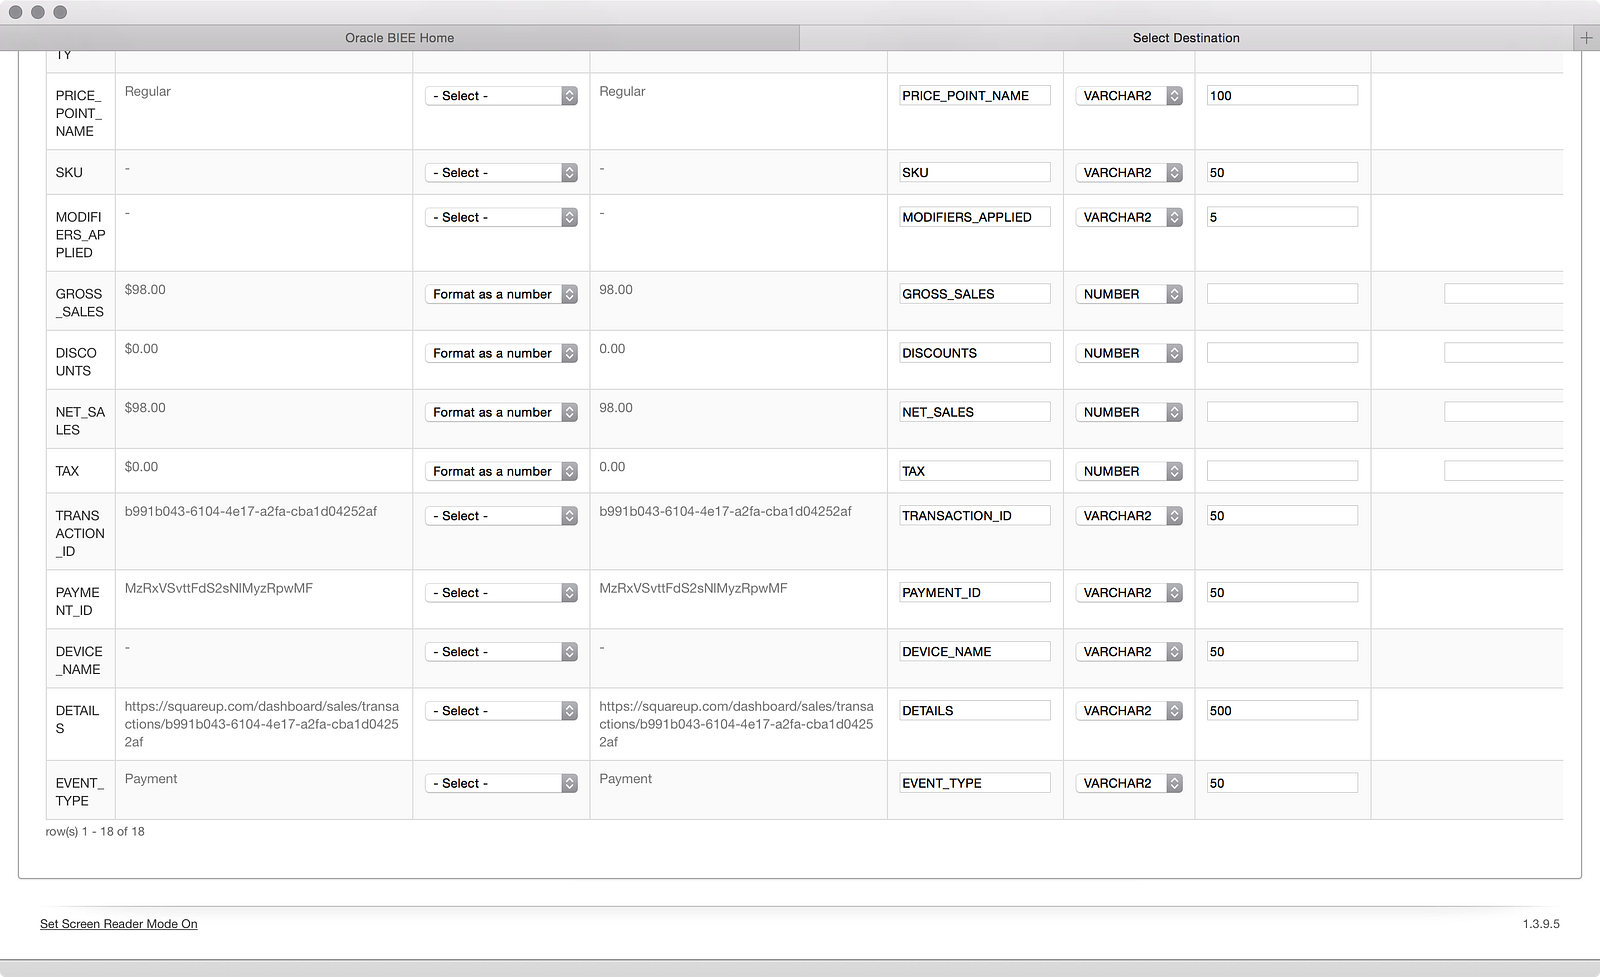
I skipped a few screenshots to get back to the one above, which is the same source-to-target mapping screen, this time reflecting my removed ‘Notes’ column. What’s noteworthy here is that I had to reapply my ‘Format as a number’ transformation and ‘NUMBER’ data type. I suppose it doesn’t make sense to remember those selections, but it would’ve saved me a bunch of clicks. Now let’s review:
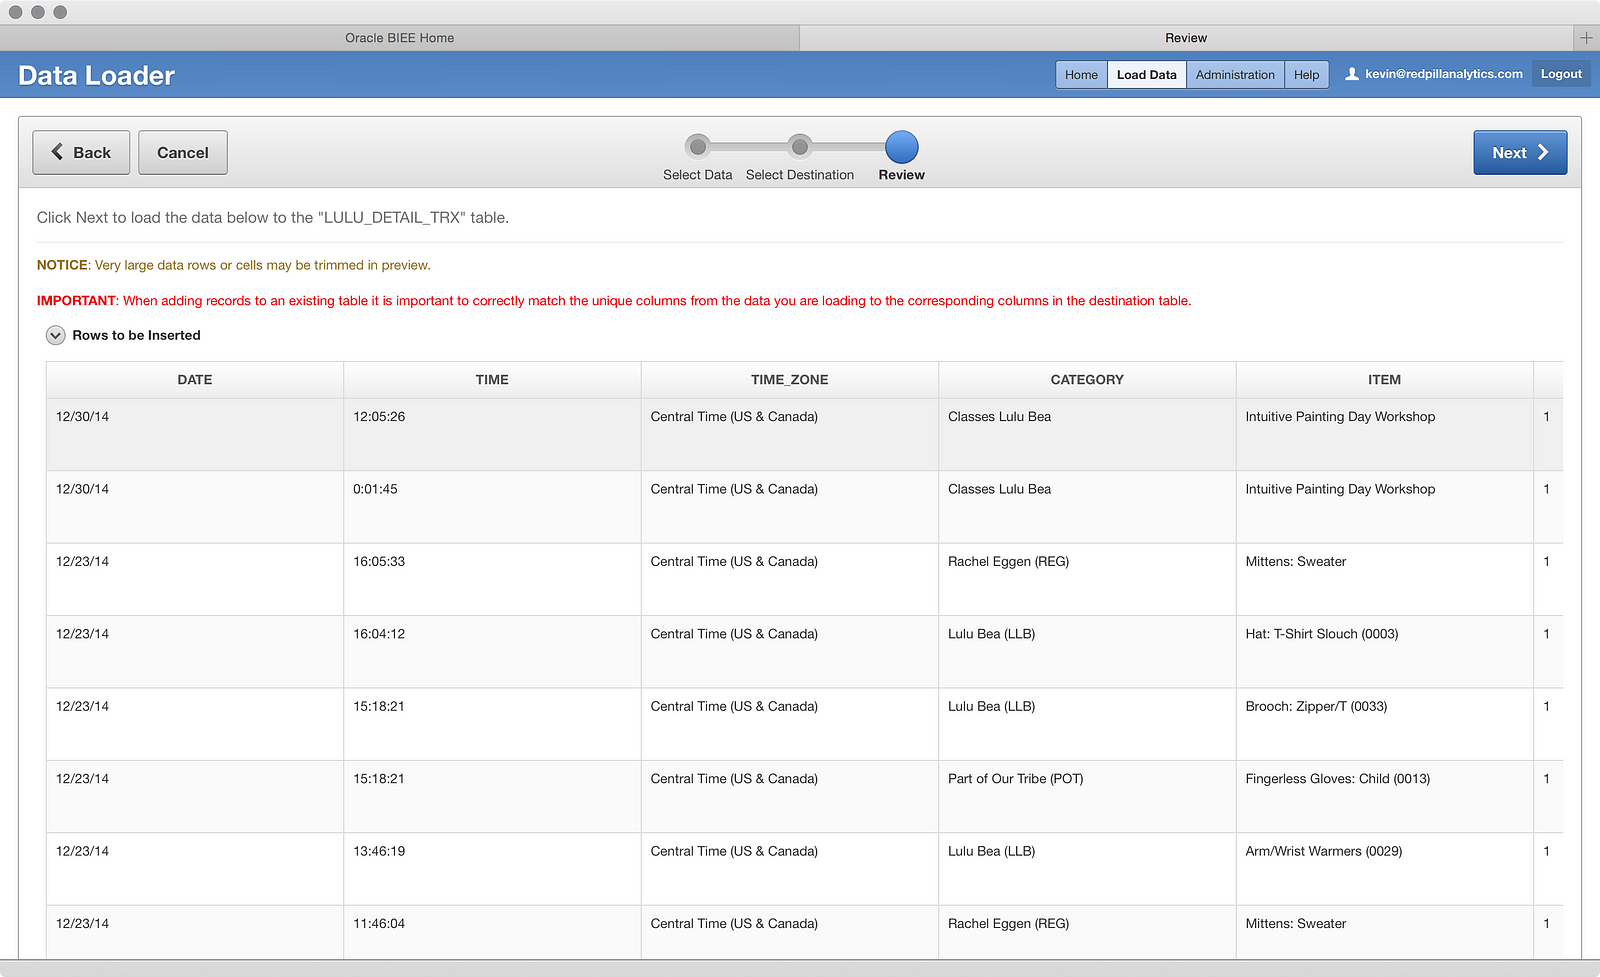
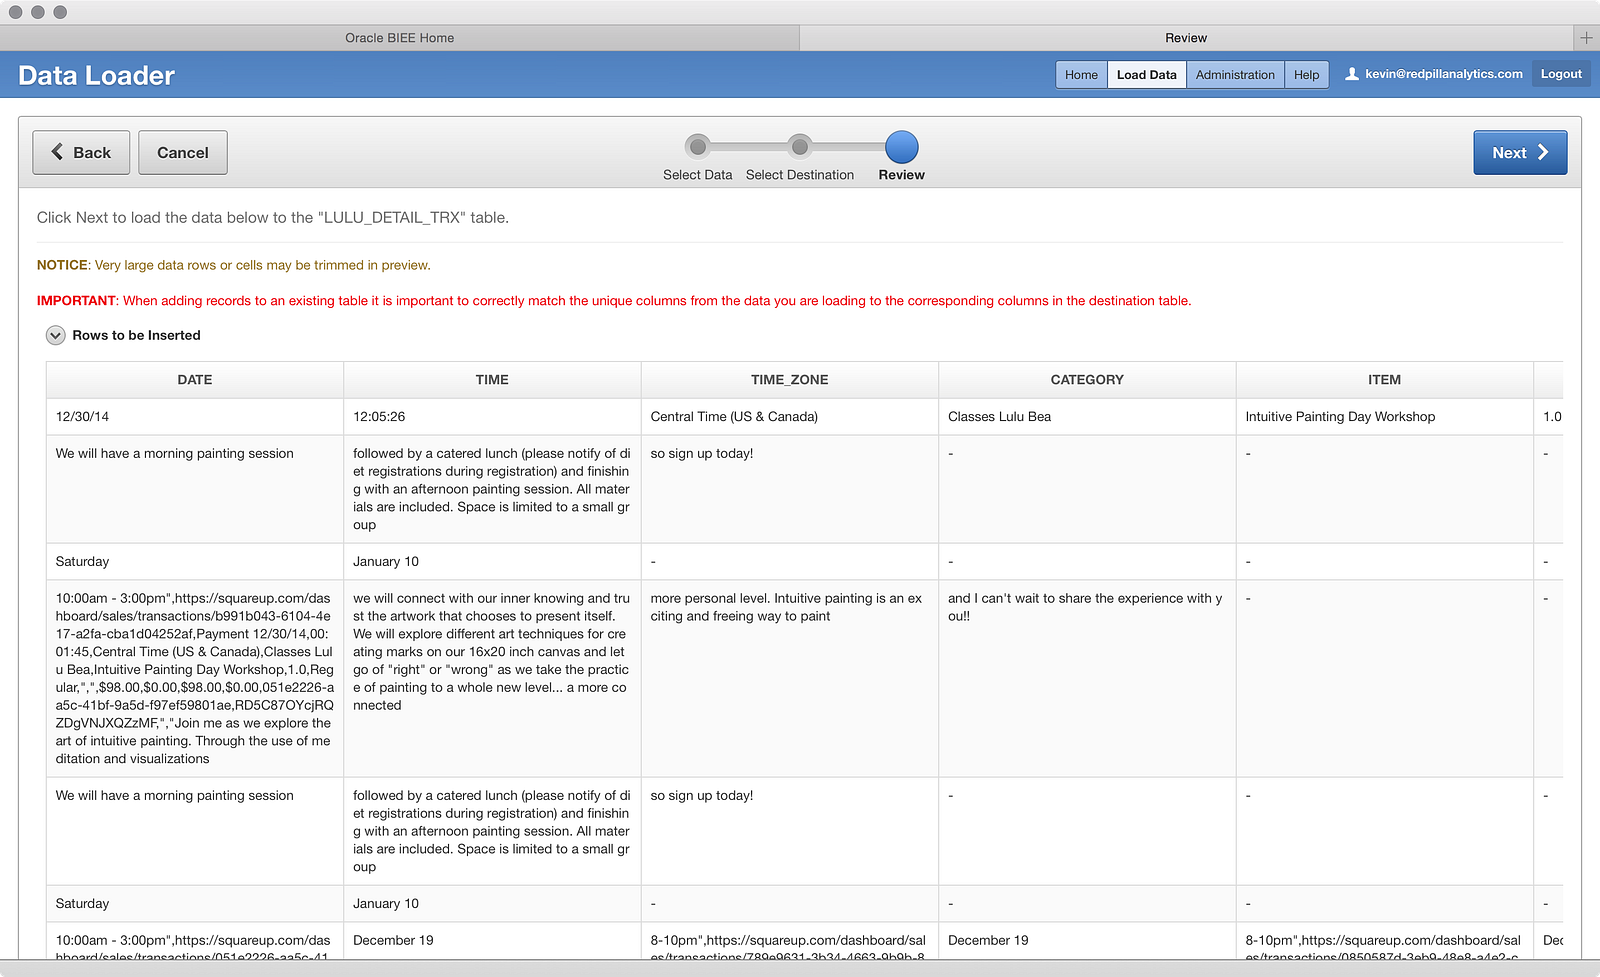
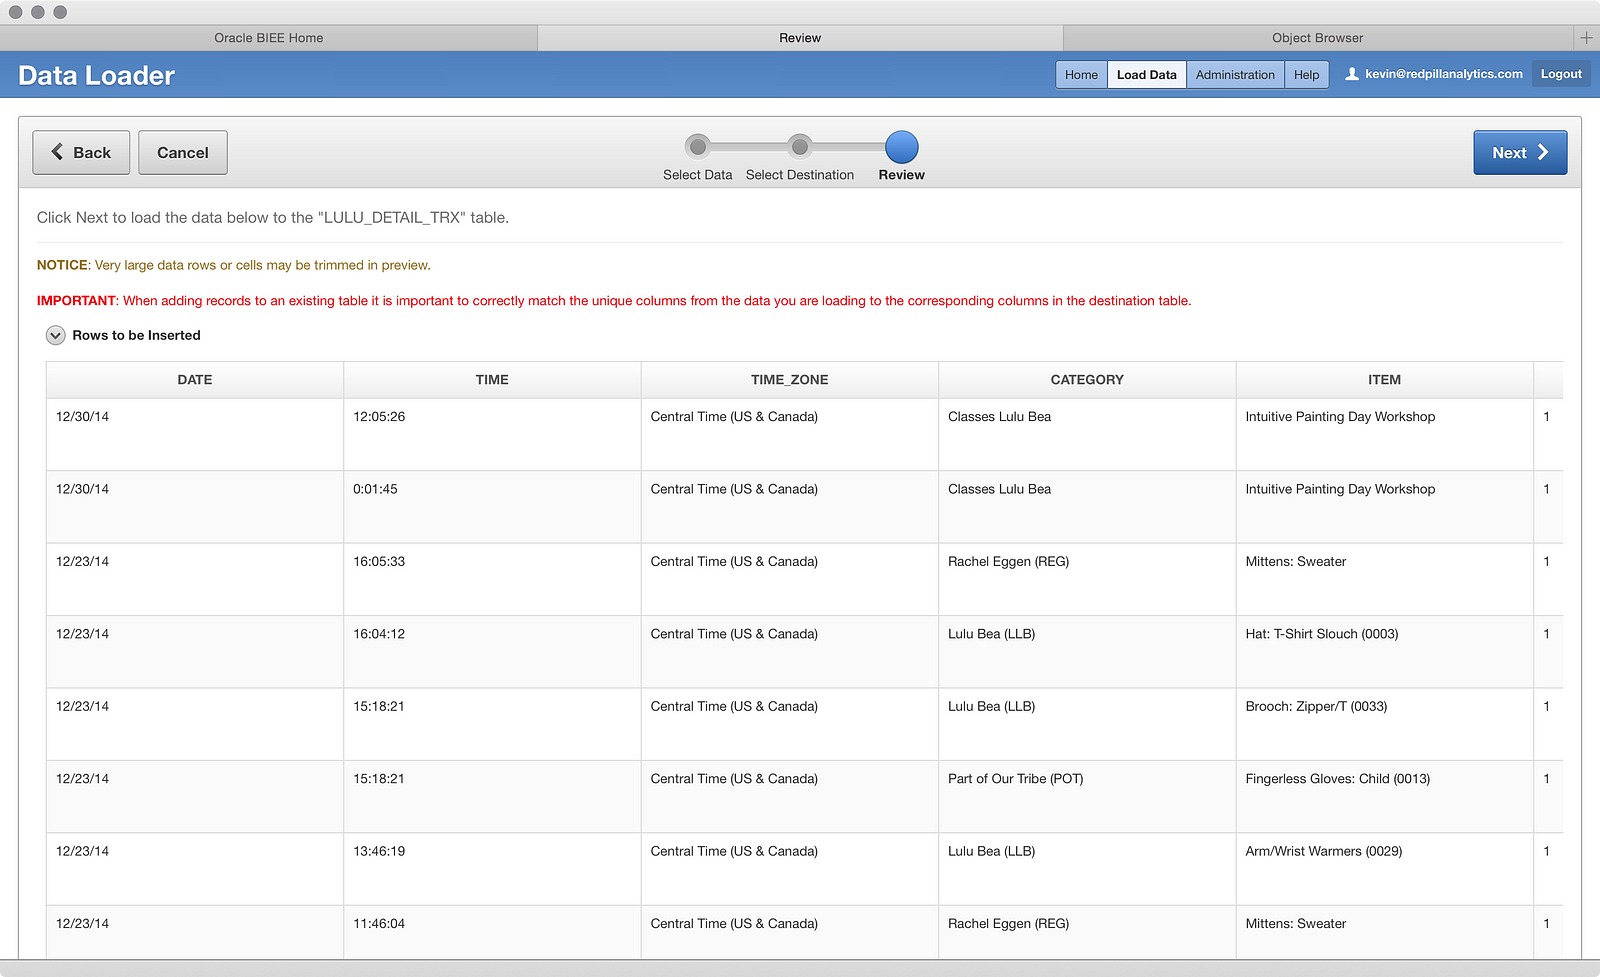
Ahh…the sweet smell of success. It looks like my data is lining up perfectly. Let’s load this sucker by clicking another big blue Next button (sense a pattern here?):
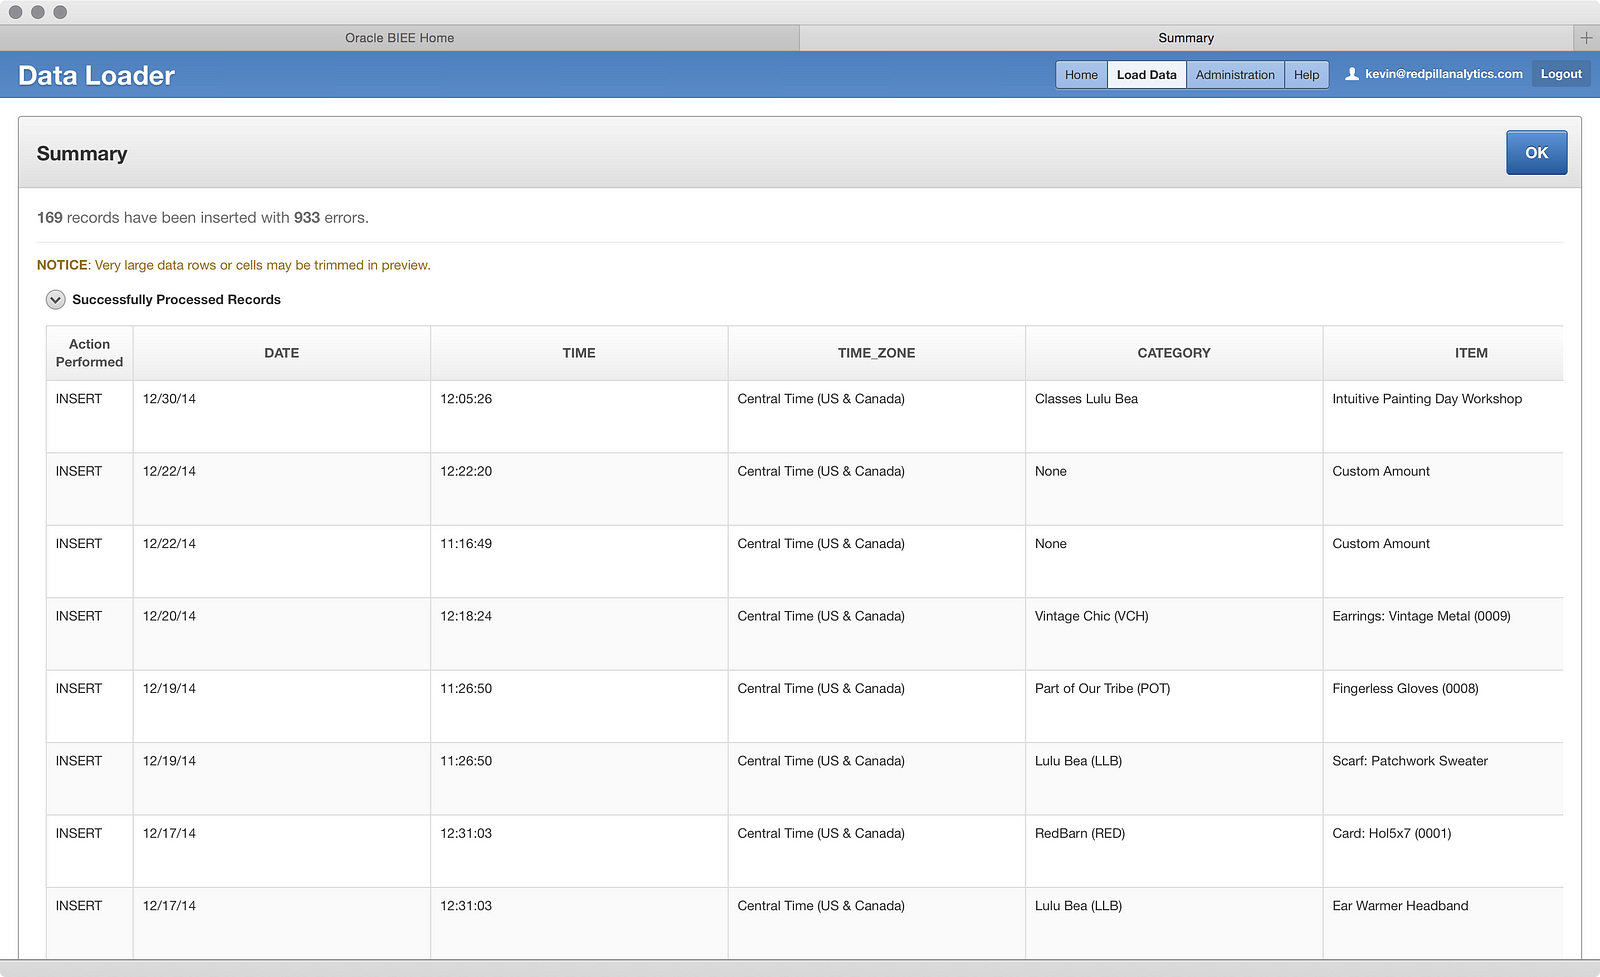
And…what the? 933 errors??? Only 169 successful rows loaded??? Bloody hell! What happened? Well, the data loader helps a little by allowing you to collapse the Successfully Processed Records to see the:
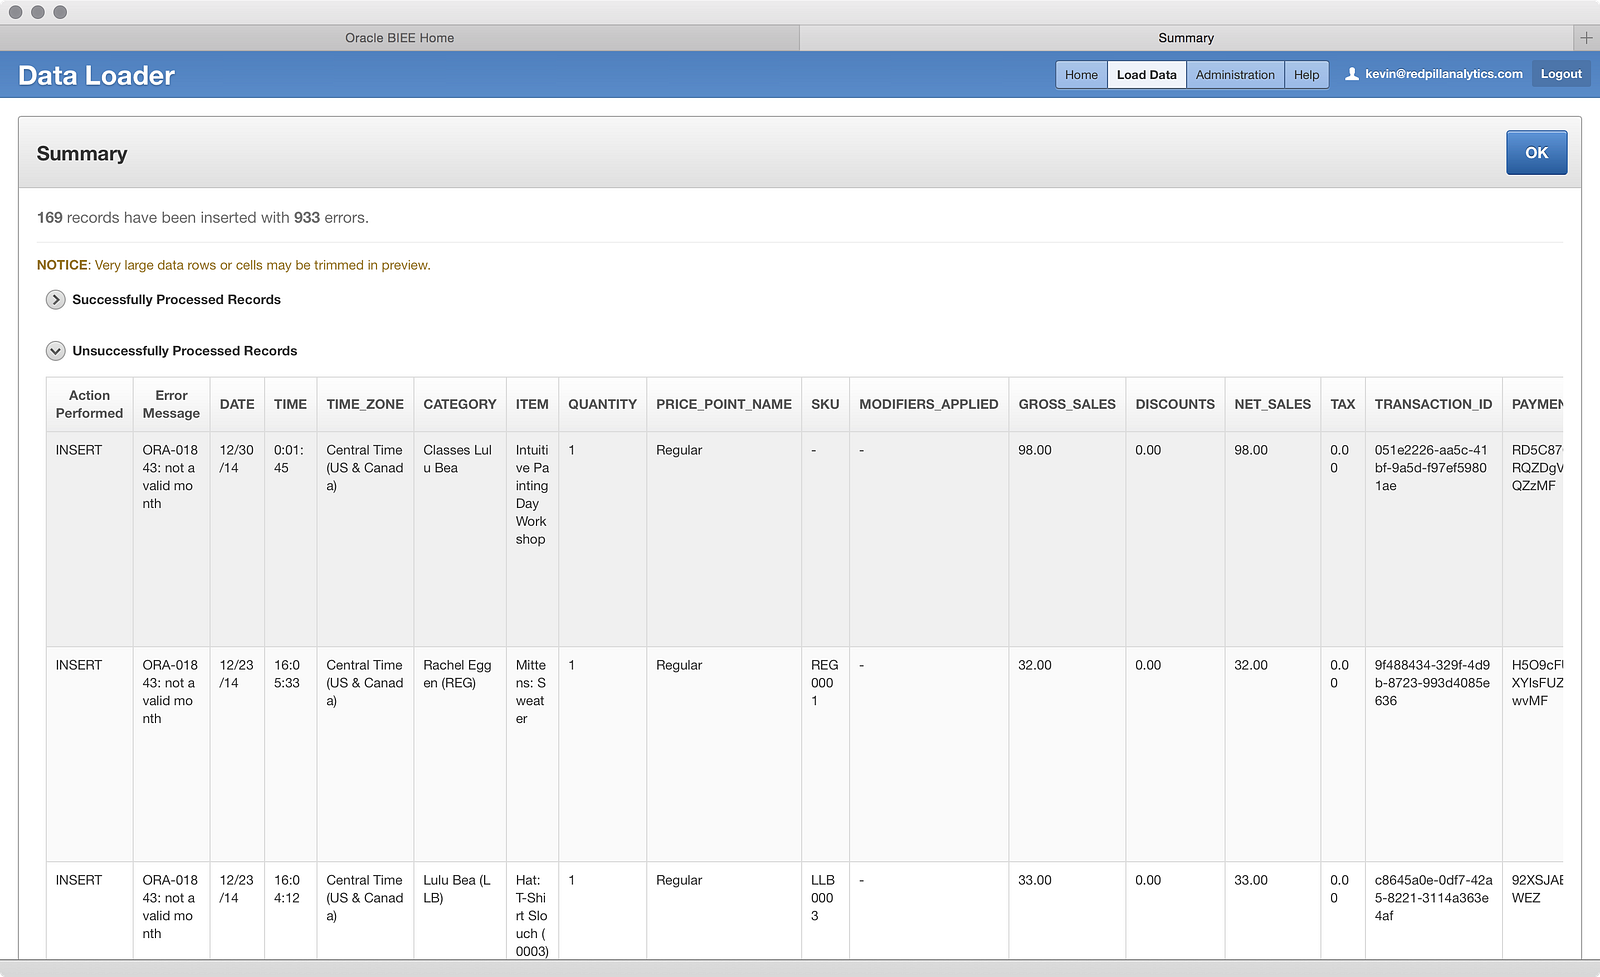
…Unsuccessfully Processed Records. Hmm, what’s going on here? There are a lot of invalid month errors, but the ‘Date’ field looks fine. Let’s click that big blue OK button and see what happens next:
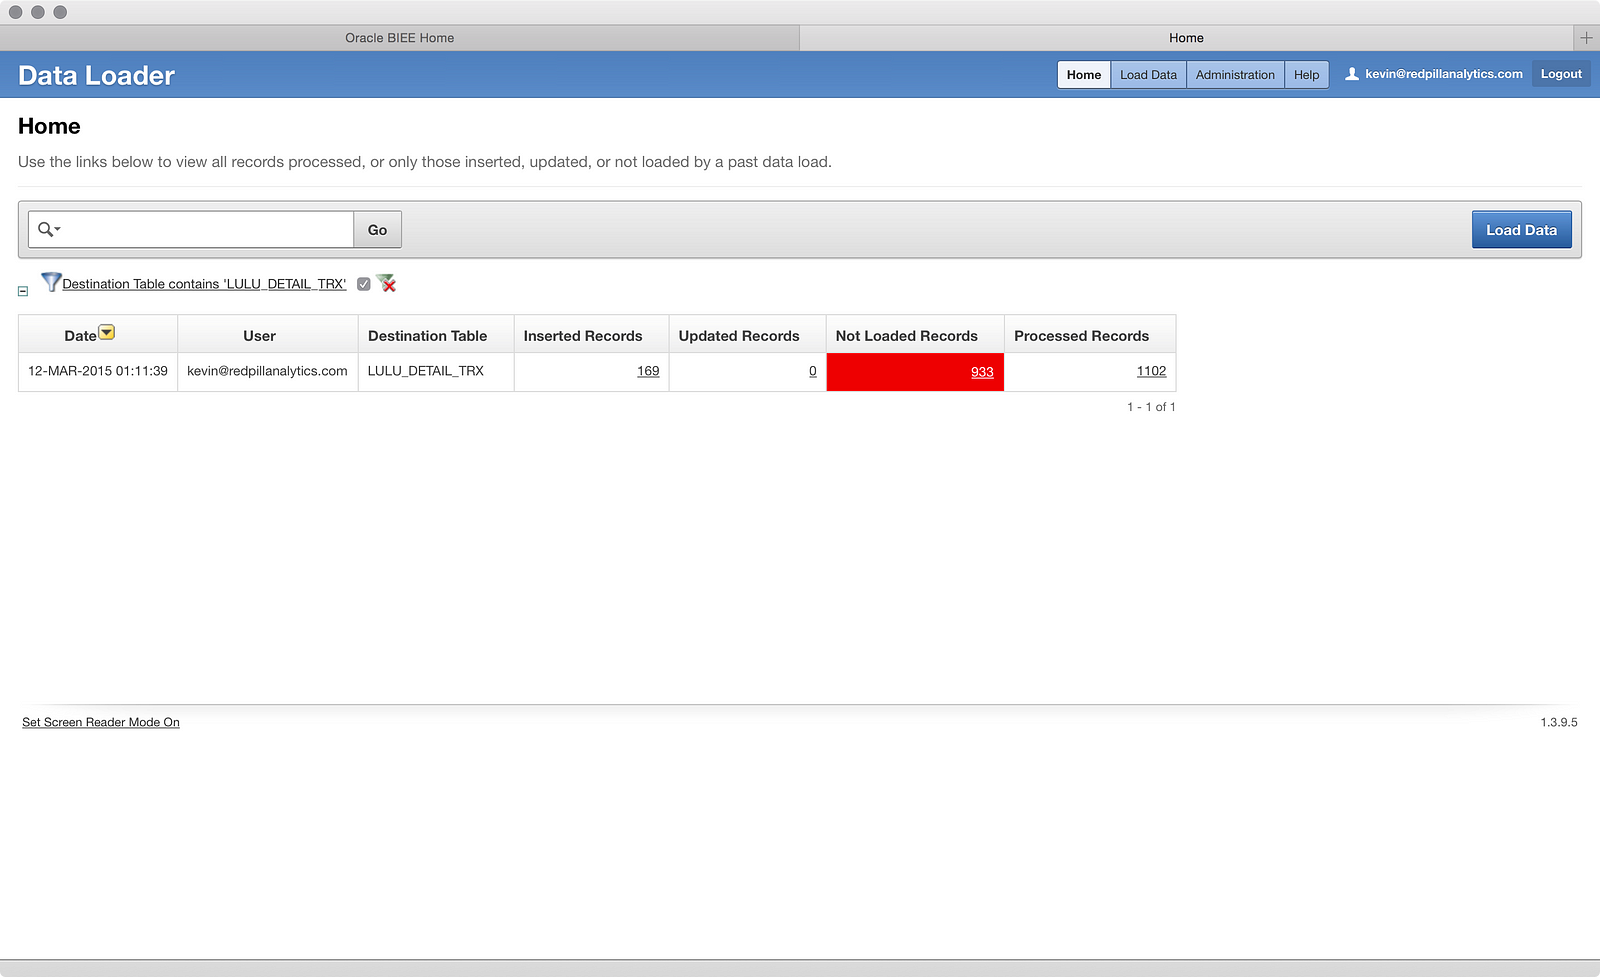
I’m taken back to the Home screen, which now shows me a load attempt into the table I’m filtering the search results on, so now I see a record. If I click on the 933 Not Loaded Records I get this screen:
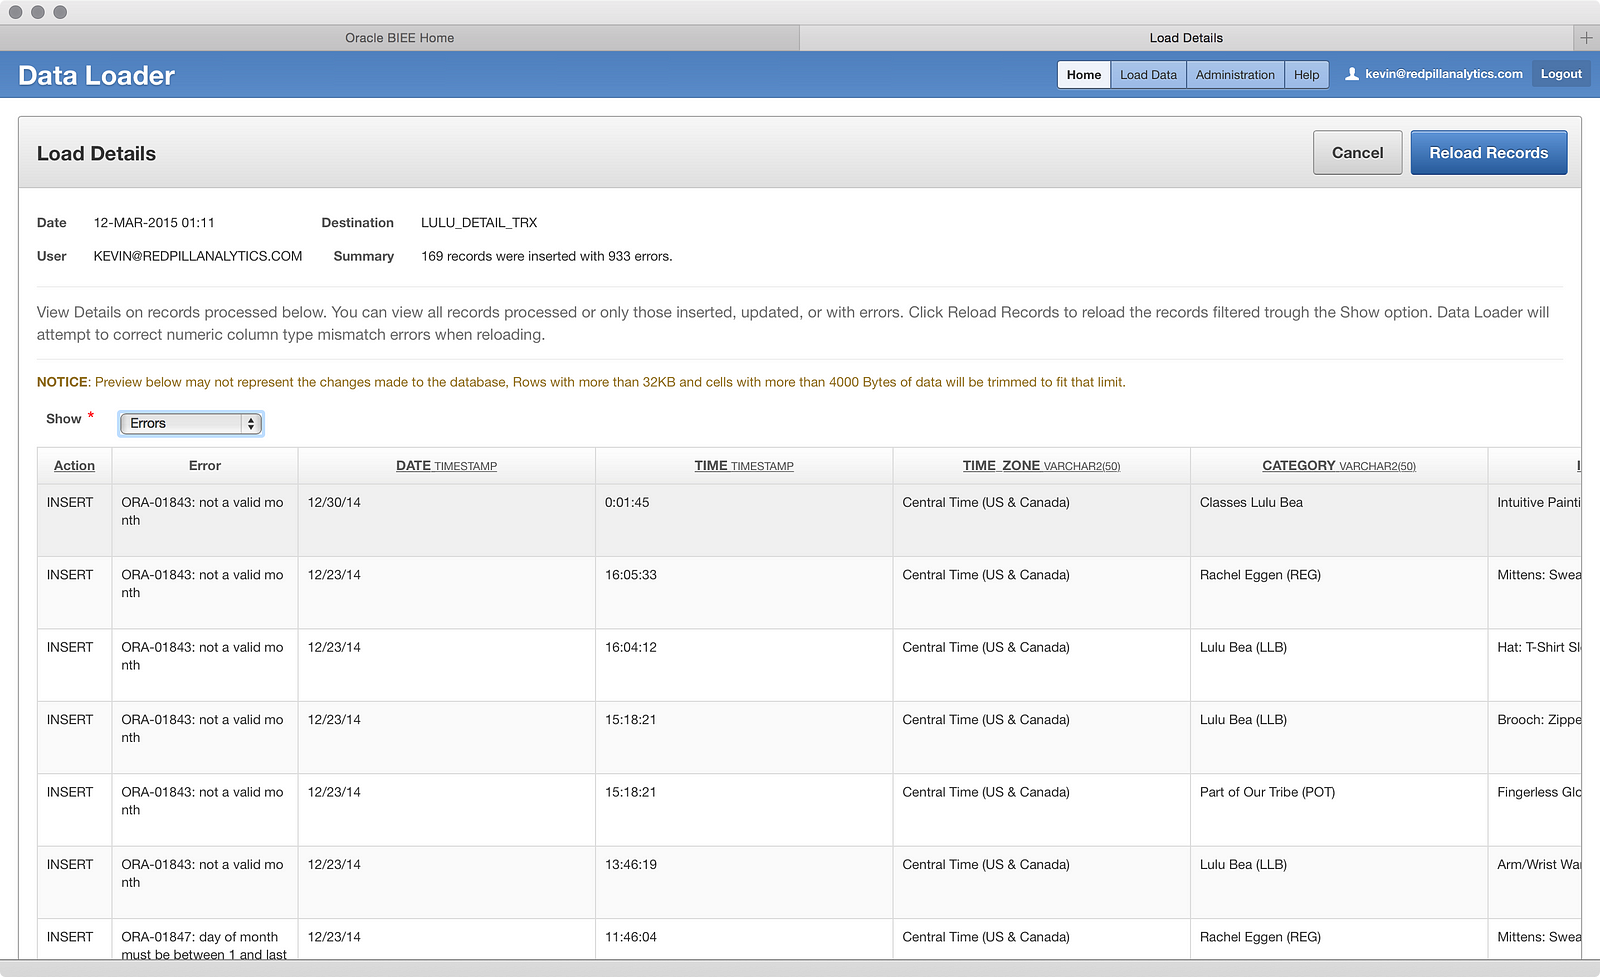
This view is a tad more helpful, if nothing else because it formats the data better. What I can also see is that the ‘TIME’ column is set as a ‘TIMESTAMP’ data type, so I bet that’s the problem. The data loader doesn’t know how to take a raw time without a data context and put it into a ‘TIMESTAMP’ column. That makes sense. I can probably load that column into a ‘VARCHAR2′ and have more success. But hmm, do I change the existing table? Drop it and re-create it? Can I reload these failed records? There are multiple options here with no clear best-practice (yet), so I’ll go ahead and drop the table and do another load, this time changing the data type of the ‘TIME’ column. To do that, I need to go to another tool within BICS:
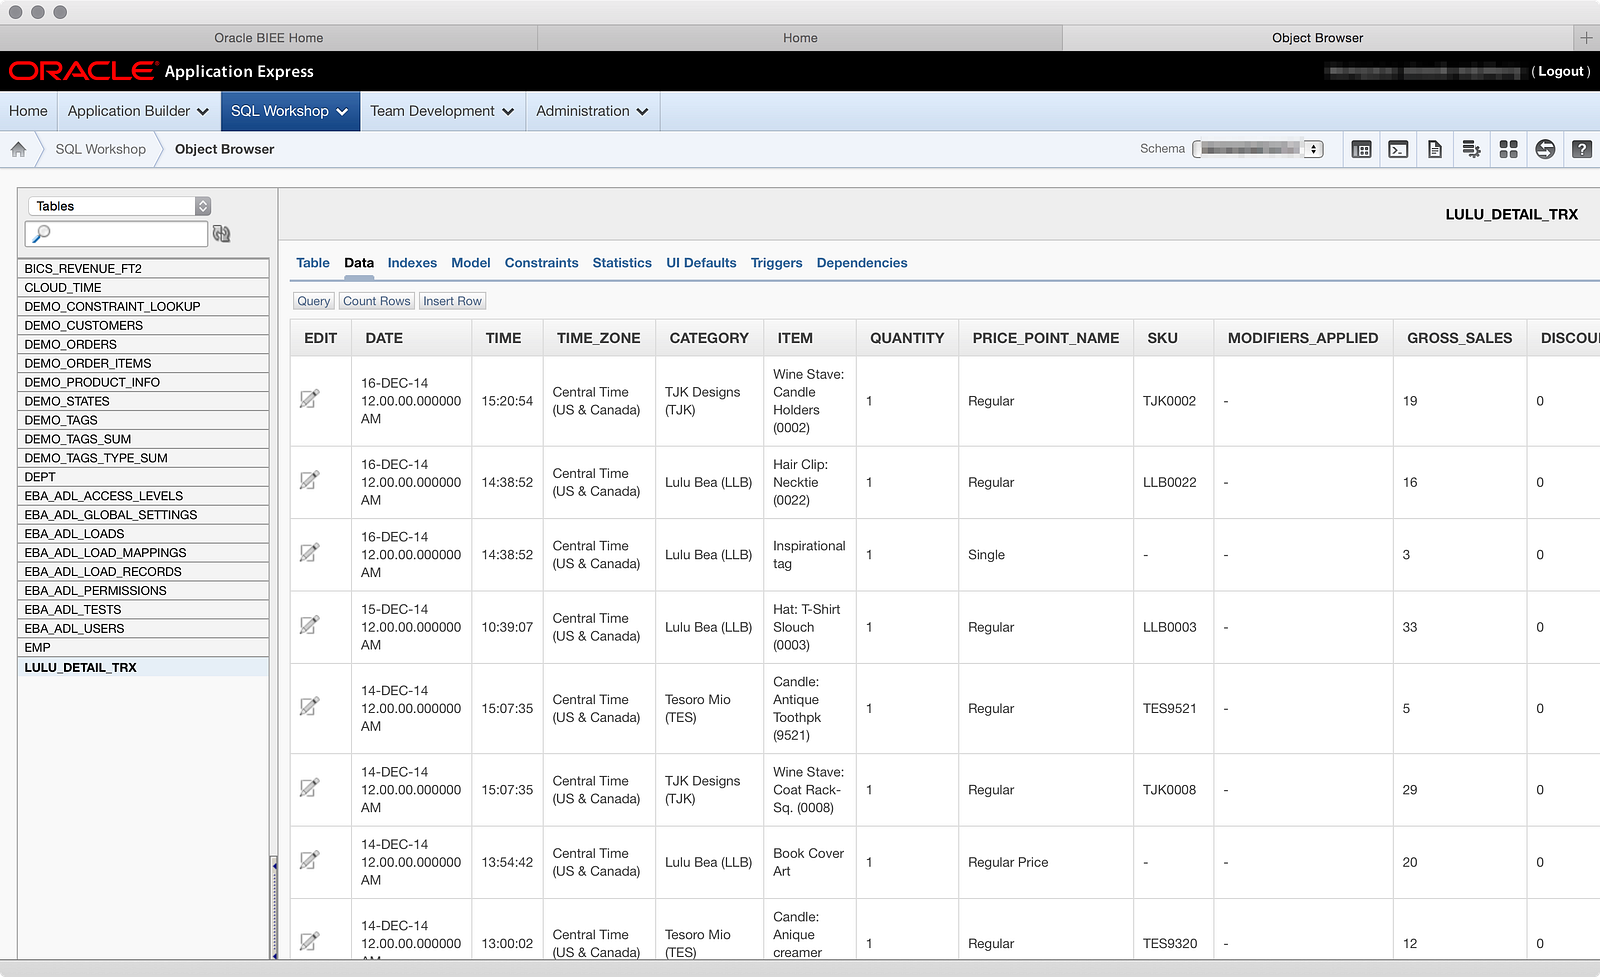
In BICS you get a database instance in the Oracle Cloud to store your uploaded data, and the primary interface to this database is APEX (though you can use SQL Developer, which I’ll attempt to setup another time). From here I can access the SQL Workshop to get to the Object Browser:
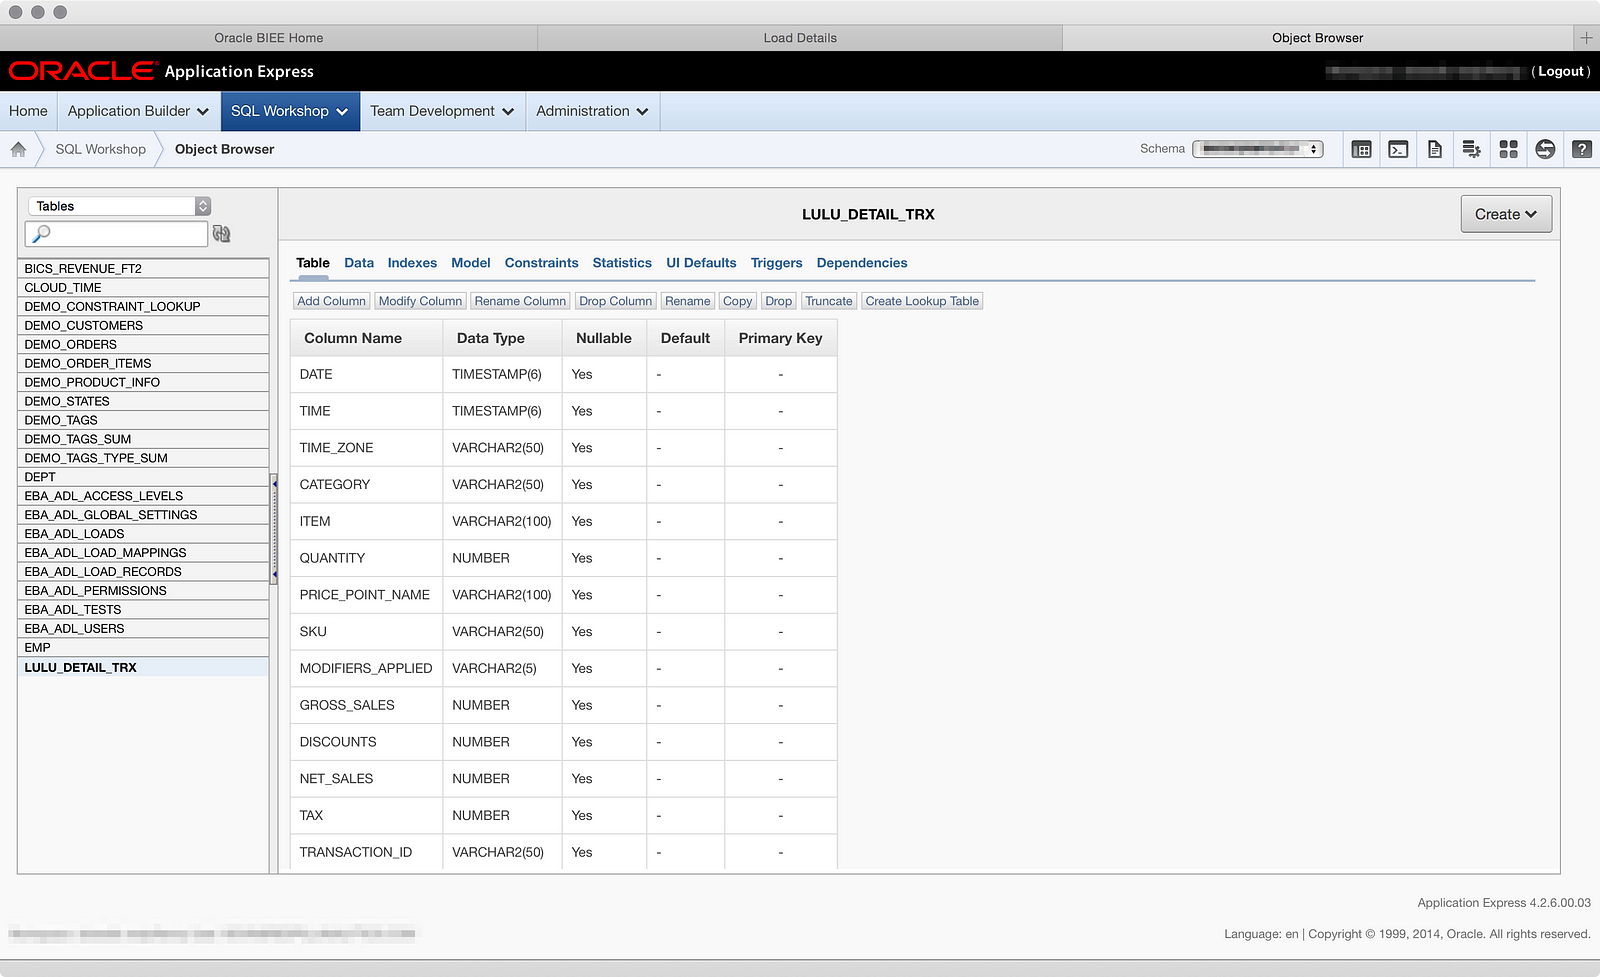
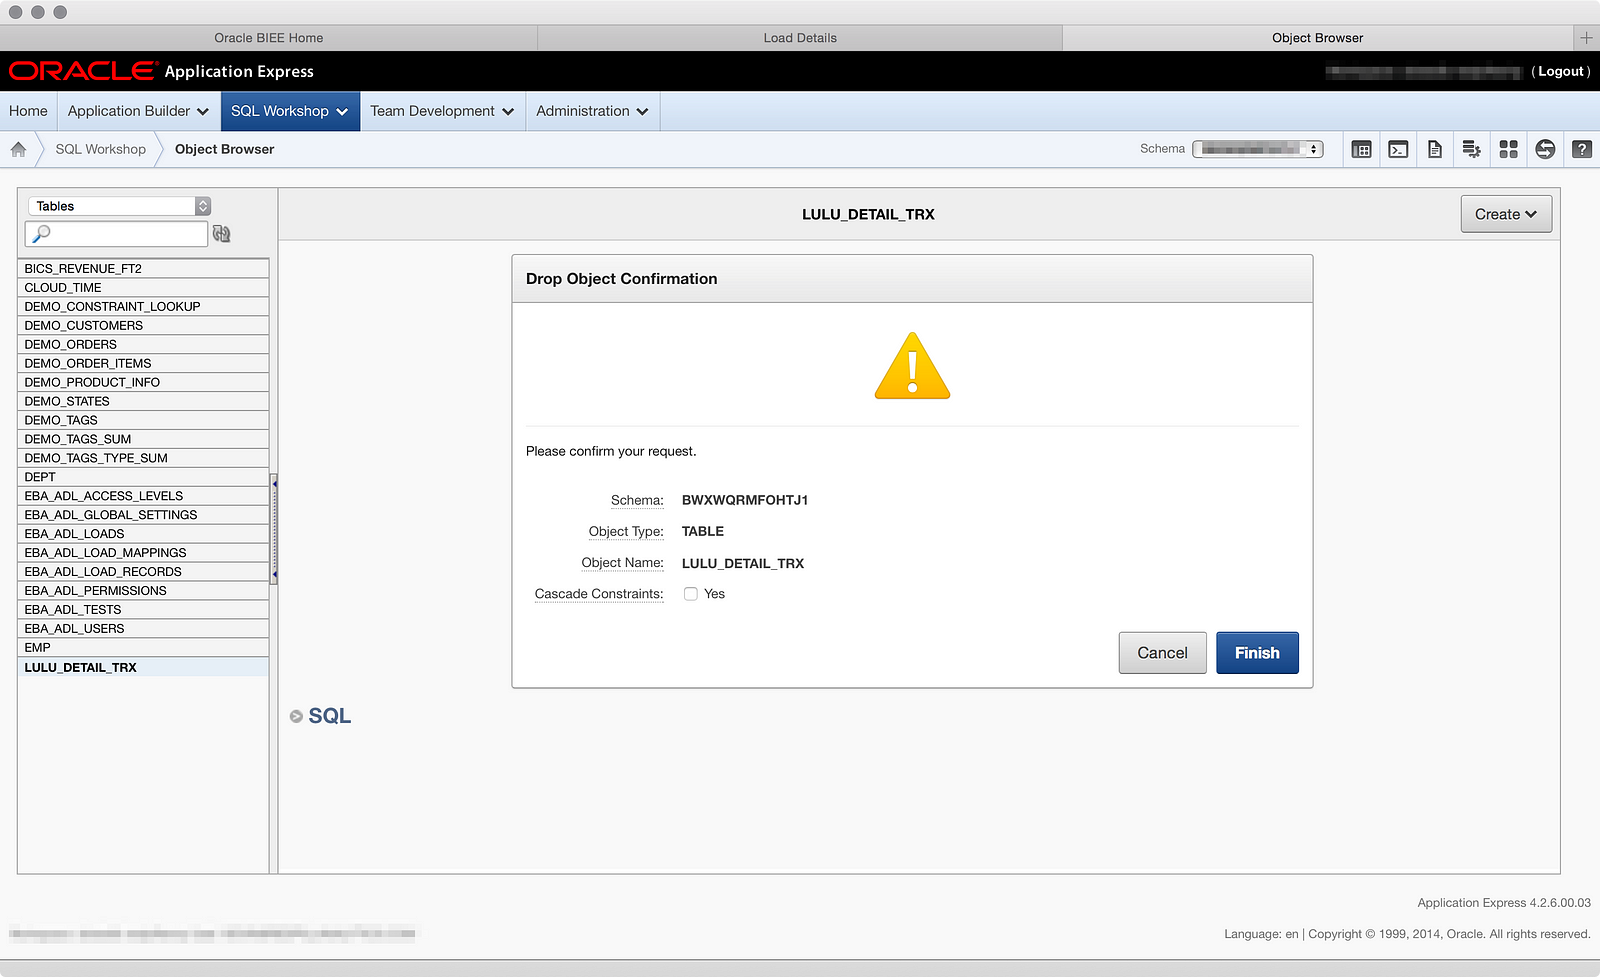
Here I can see the table I created through the Data Loader and amongst all the options on the page, I can Drop the table:
Now that I’ve dropped the table, let’s go back and re-upload the file, this time setting the ‘TIME’ column to a ‘VARCHAR2′ data type, which you can see here:
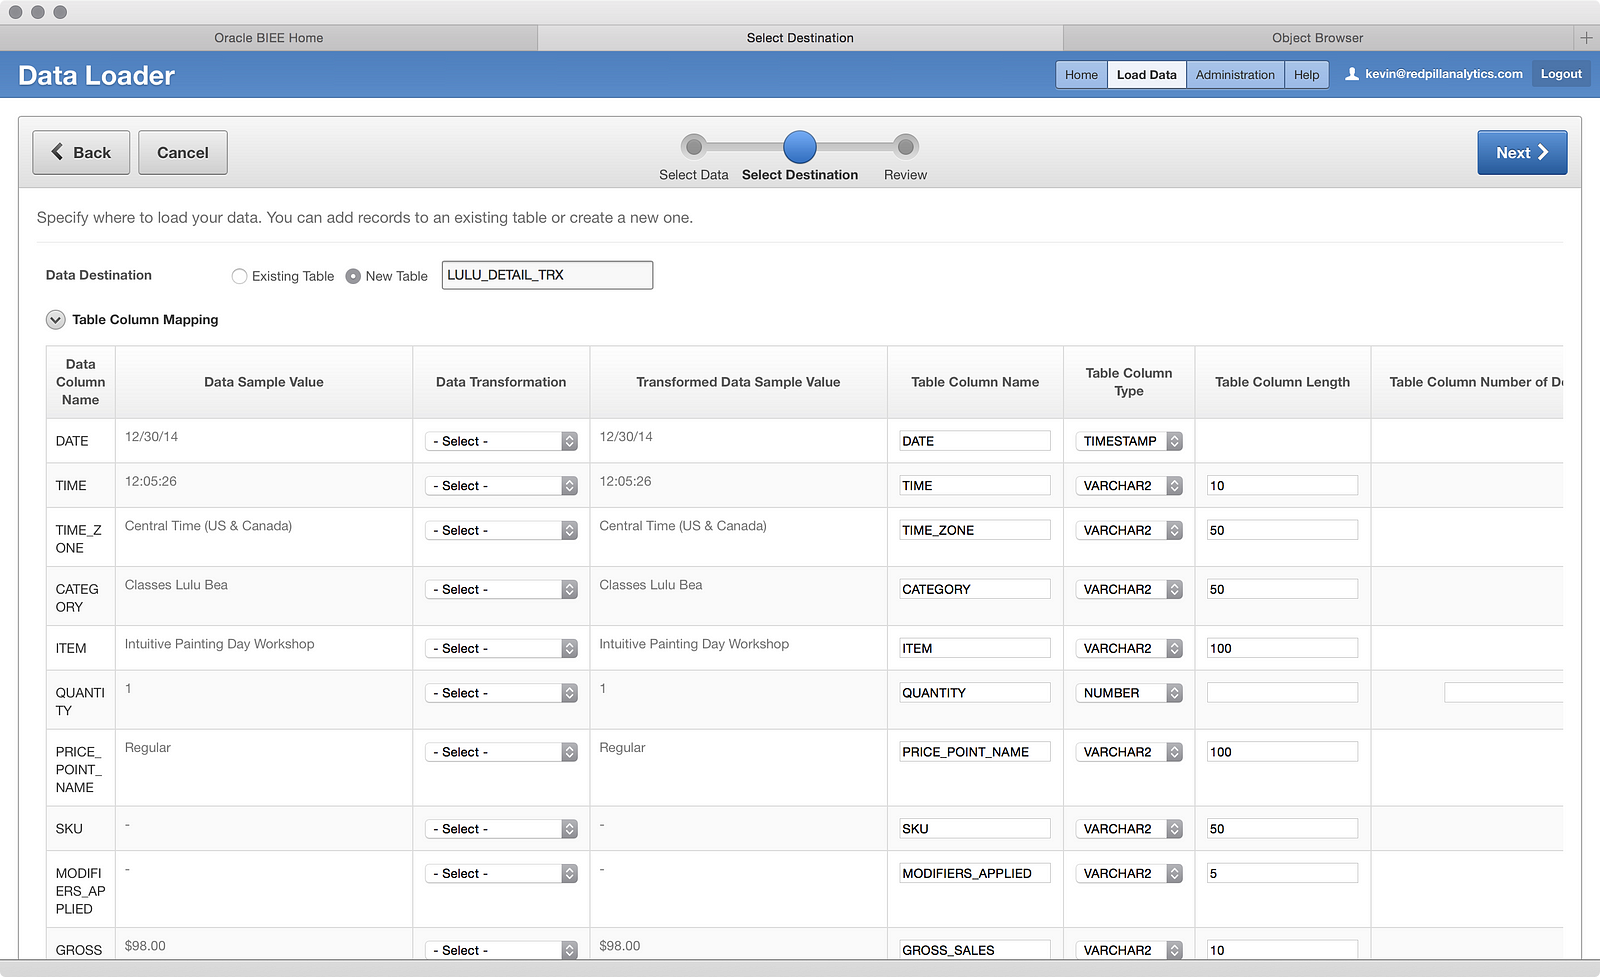
Unfortunately, the data loader did not remember that I wanted those dollar columns set to numbers instead of text, so I had to apply that again as well:
Now let’s review our source-to-target:
And load the data (cross your fingers):
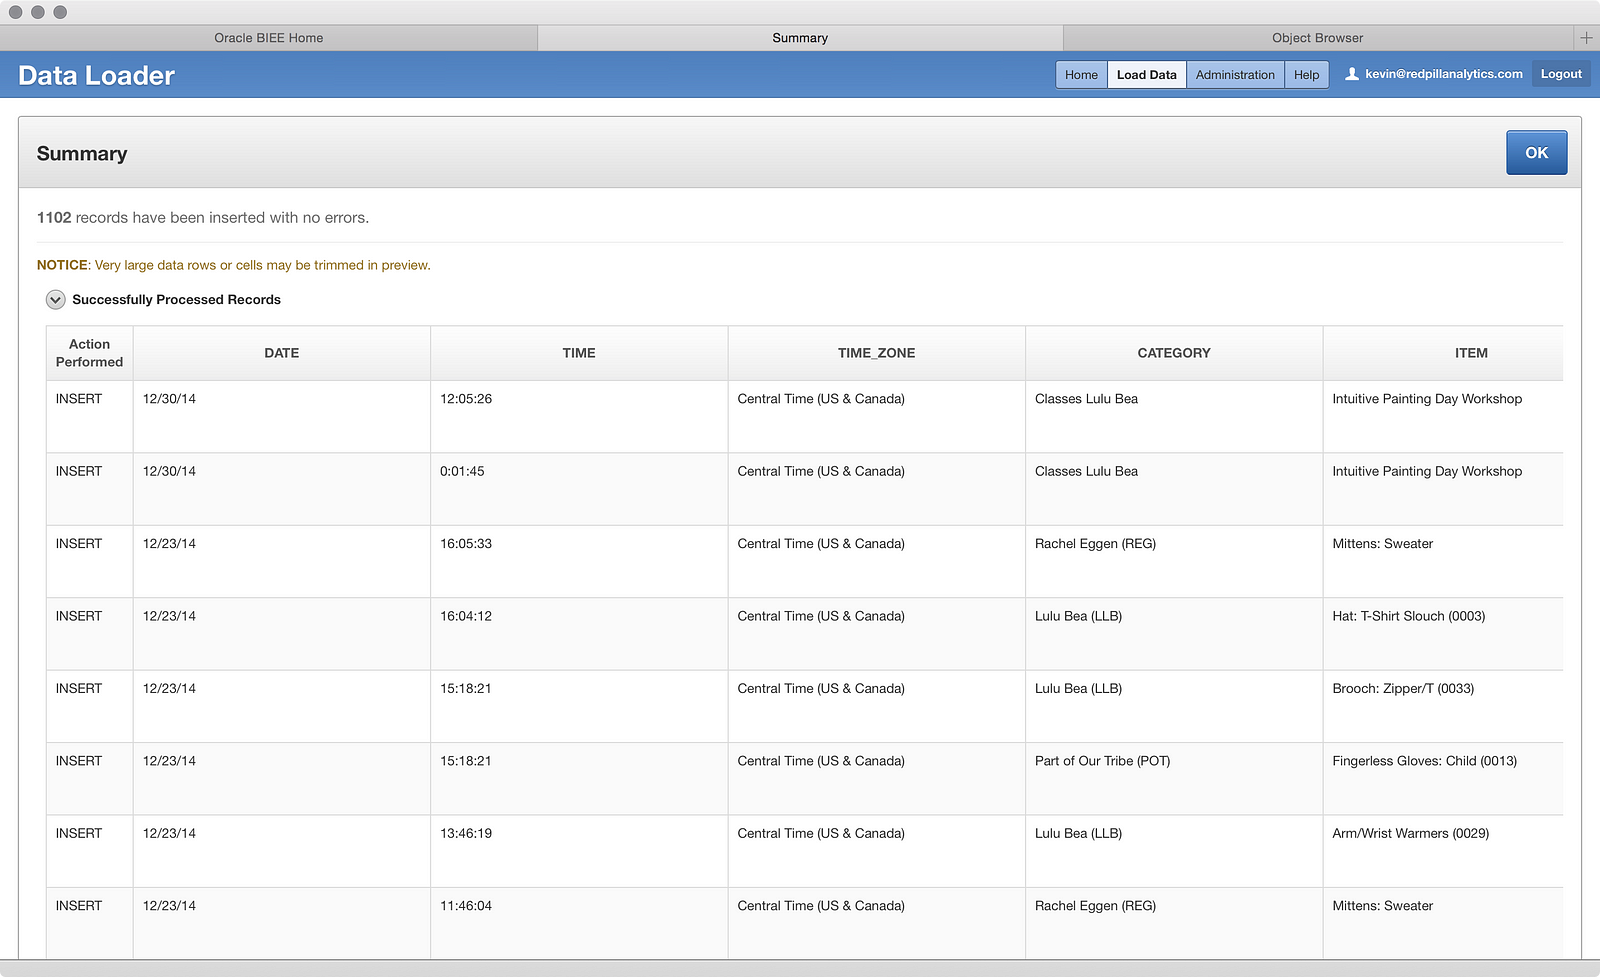
Sweet. All rows loaded with no errors. If we click OK:

We see our successful run. If you’re wondering why a third run appears there where all rows failed, it’s because I accidentally set the ‘TIME’ column to a ‘NUMBER’ data type and tried a load, which it obviously barfed at. I didn’t think it was worth your time to walk through that inadvertent mistake. But, after all that, we now have a table with one year of data, as shown in the Object Browser:
Next I’ll try adding those other two files into the same table, and from there I’ll start building some metadata. You can read Part 02 here.
4 Responses to Oracle BICS DITL Part 01