
I will be speaking at Oracle OpenWorld on Self-Service BI for Super Usersand the purpose of the talk is to outline various approaches and tips for leveraging different features across OBIEE, BI Publisher, and Endeca Information Discovery to enable better self-service capabilities for your users. Unfortunately, “self-service” is one of those terms like “big data” — ask 20 people and you’ll get 20 answers. That’s why I think it’s important to talk about different options for enabling various degrees of self-service BI in your organization.
One of the features within OBIEE that often gets overlooked is the “Direct Database Request” (DDR) feature that appears as an alternative to choosing a subject area when building an Analysis, as shown in the screenshot below:
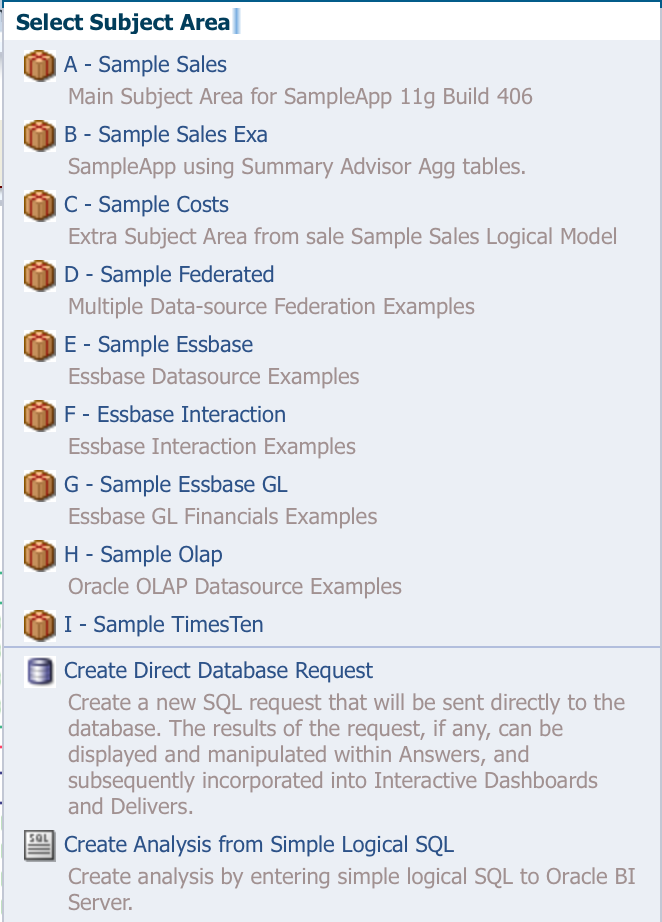
The basic premise of the DDR feature is that you give users access to the name of a connection pool in the RPD and they are able to issue physical SQL to that connection pool as if they were the BI Server itself, thus bypassing the metadata layer, while still maintaining most of the functionality that an Analysis provides (more on my emphasis of the word most later). If you’re immediately thinking this sounds like a potentially dangerous feature, you’d be right, because there are minimal controls in OBIEE for what type of SQL, good or bad, a user can write. Because of this, and because most people buy OBIEE to take full advantage of the metadata layer, the DDR feature is often denied to users in many OBIEE implementations. In fact, most users don’t have access to it by default and have to be granted permission to use (which is a good thing).
However…with renewed focus on self-service, Oracle customers looking to migrate from dying tools like Discoverer, Interactive Reporting, and other ERP query tools, and the business demanding database access for departmental tools like Tableau and Qlik, there’s a case to be made that the DDR feature is exactly what certain types of users need — and there are benefits to giving it to them.
First, let’s talk about the feature itself and how it works. Upon selecting DDR in the screenshot above, the user is presented with this screen:
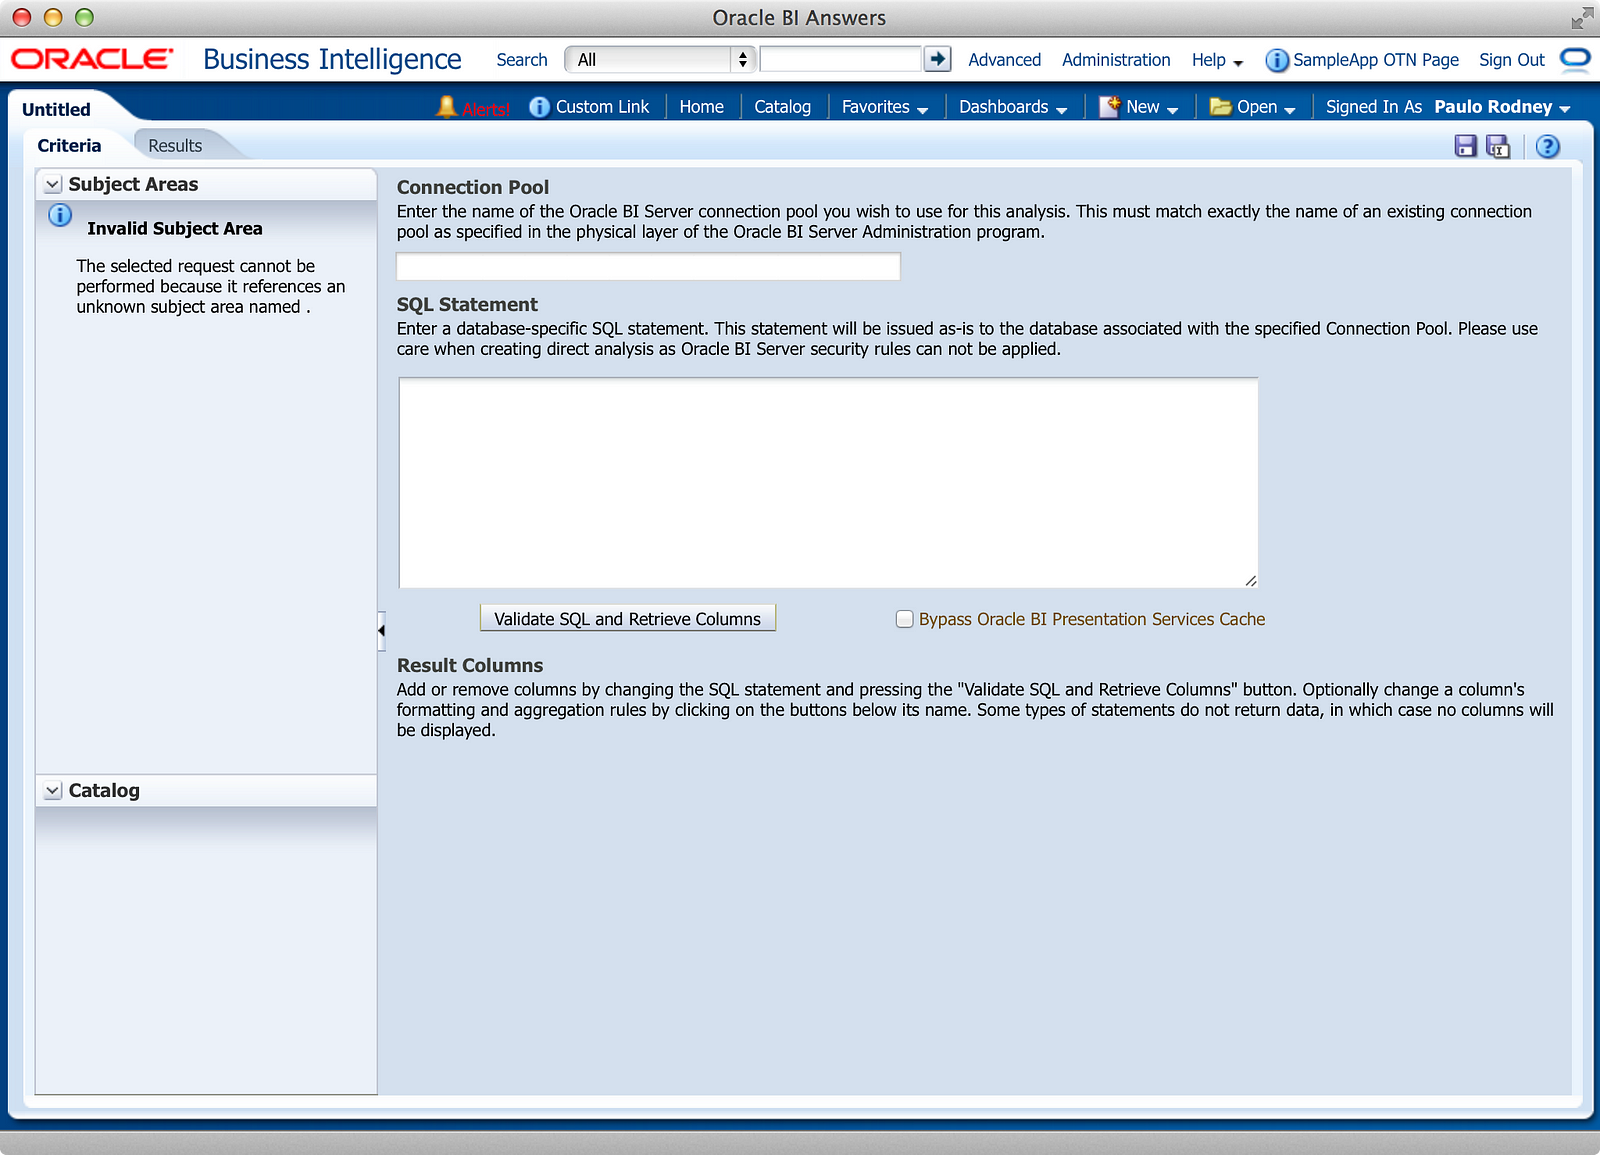
There are five primary steps to using DDR:
- Identify the connection pool you want to use
- Write/Paste your SQL statement in the editor
- Validate the SQL and retrieve the SELECT columns
- Apply the typical Analysis column properties and aggregation rules
- Build your views on the Results tab as if it were any other Analysis (almost)
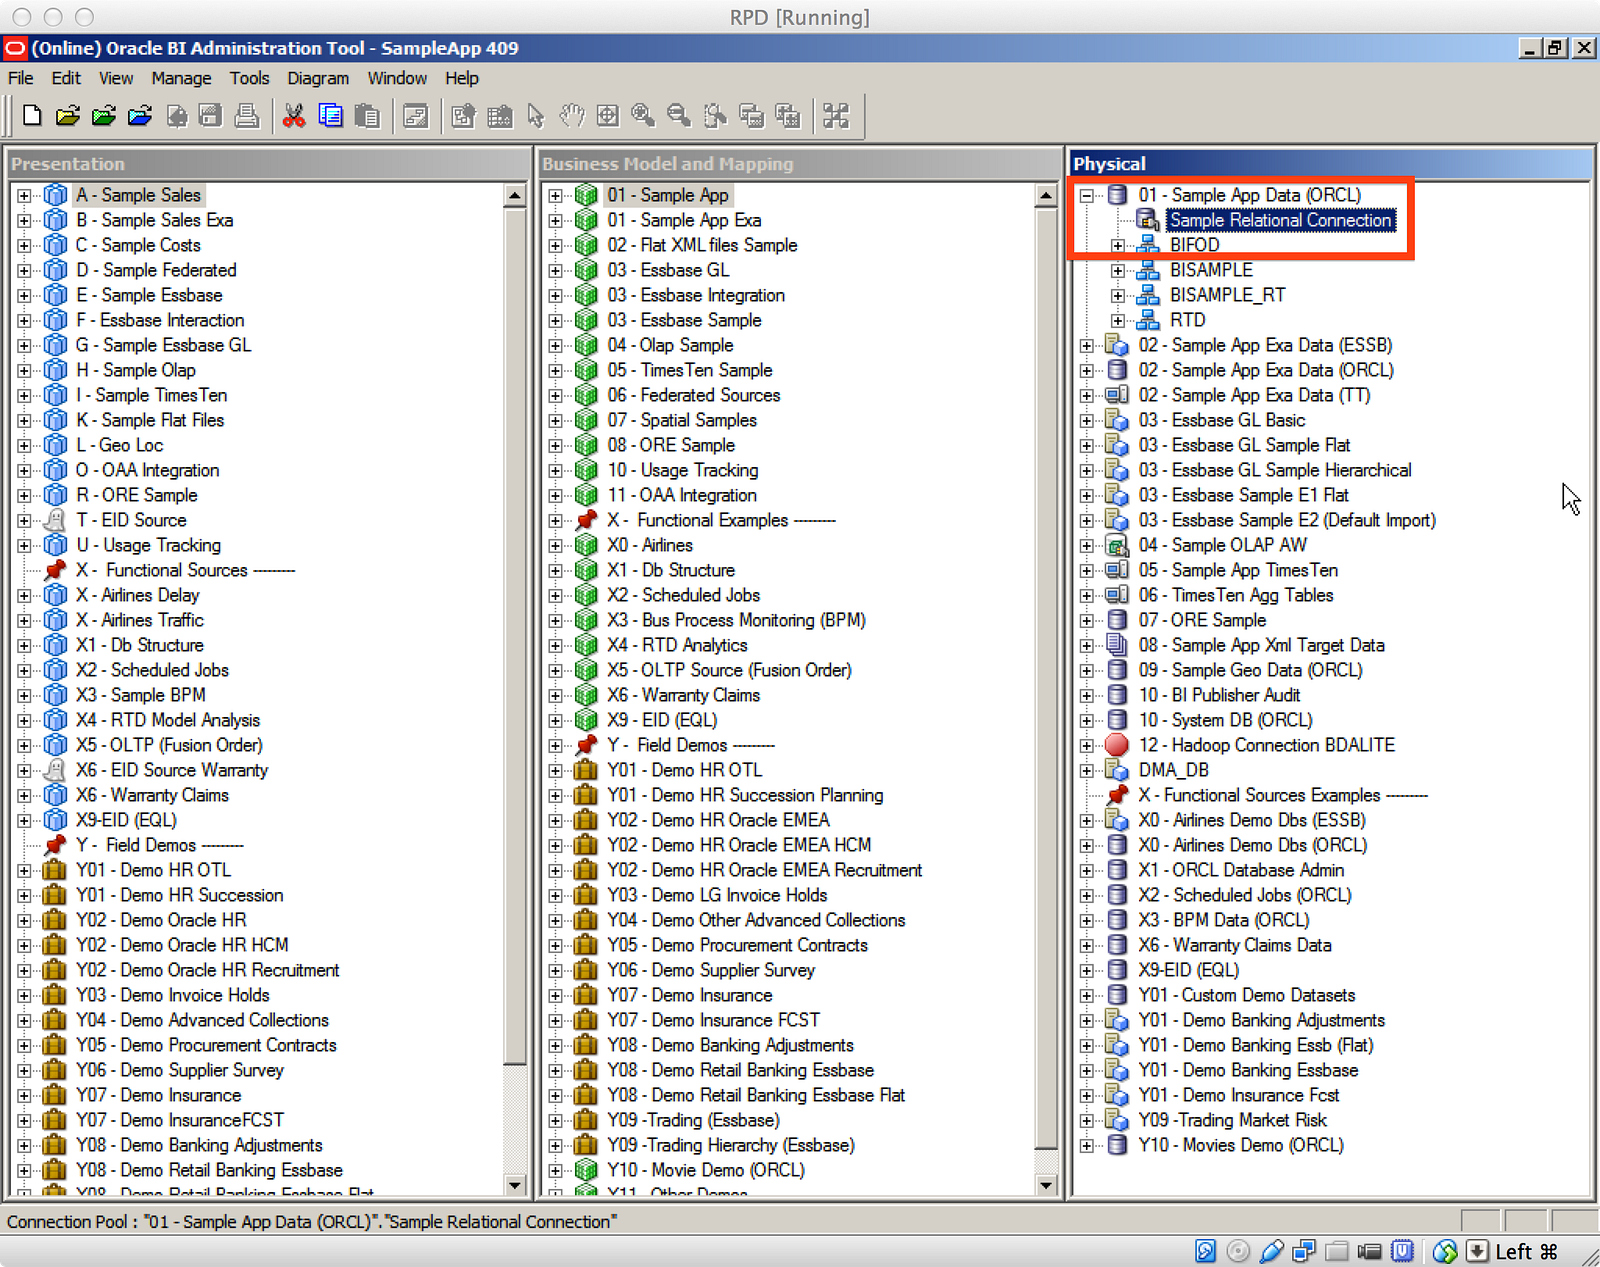
If you’re not familiar with Connection Pools in OBIEE, you can see in the above screenshot an example of one such Connection Pool in Oracle’s SampleApp. This object contains detailed information for how OBIEE should connect to this particular database. While you only see one Connection Pool for this particular database, it’s possible to have many, and I’ll mention in Part 2 why you’d specifically want to do that when using DDR.
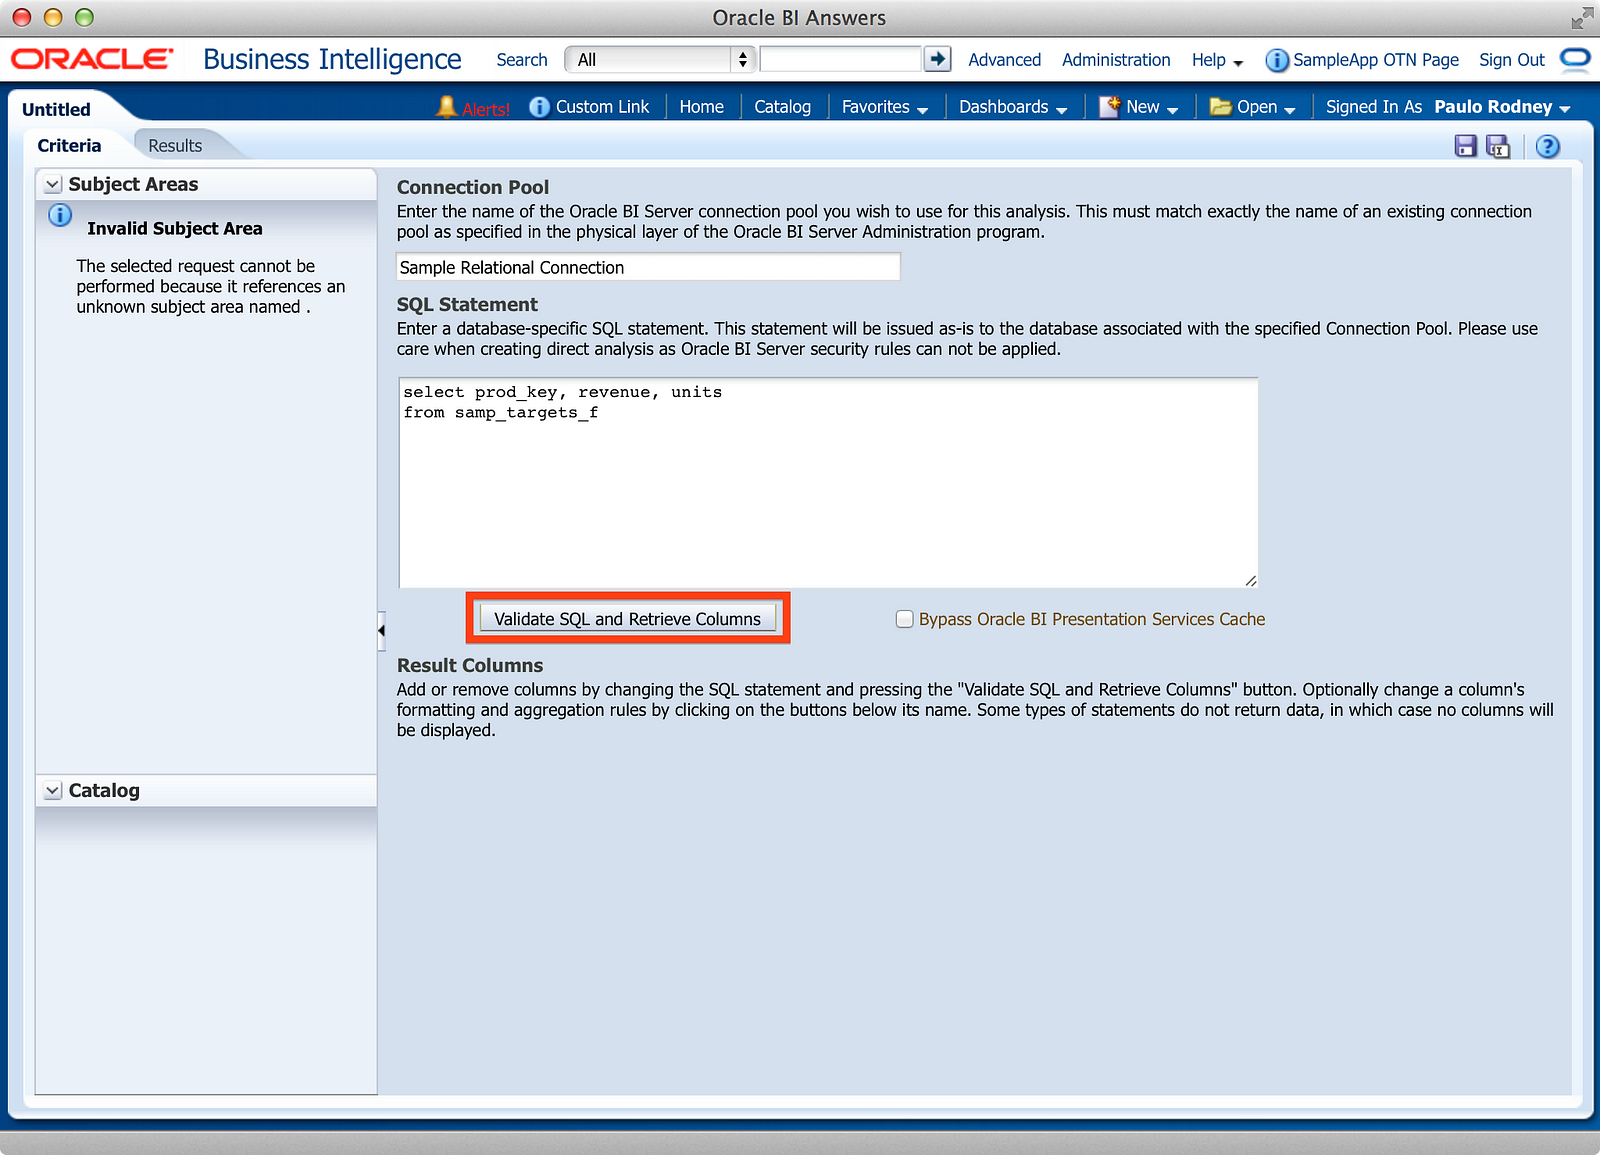
After typing in your SQL, as shown in the above screenshot, you click the “Validate SQL and Retrieve Columns” button in the middle of the screen. This step serves two purposes: first to make sure the SQL doesn’t error, and second to convert the SQL text into usable Criteria columns typical of a standard Analysis.
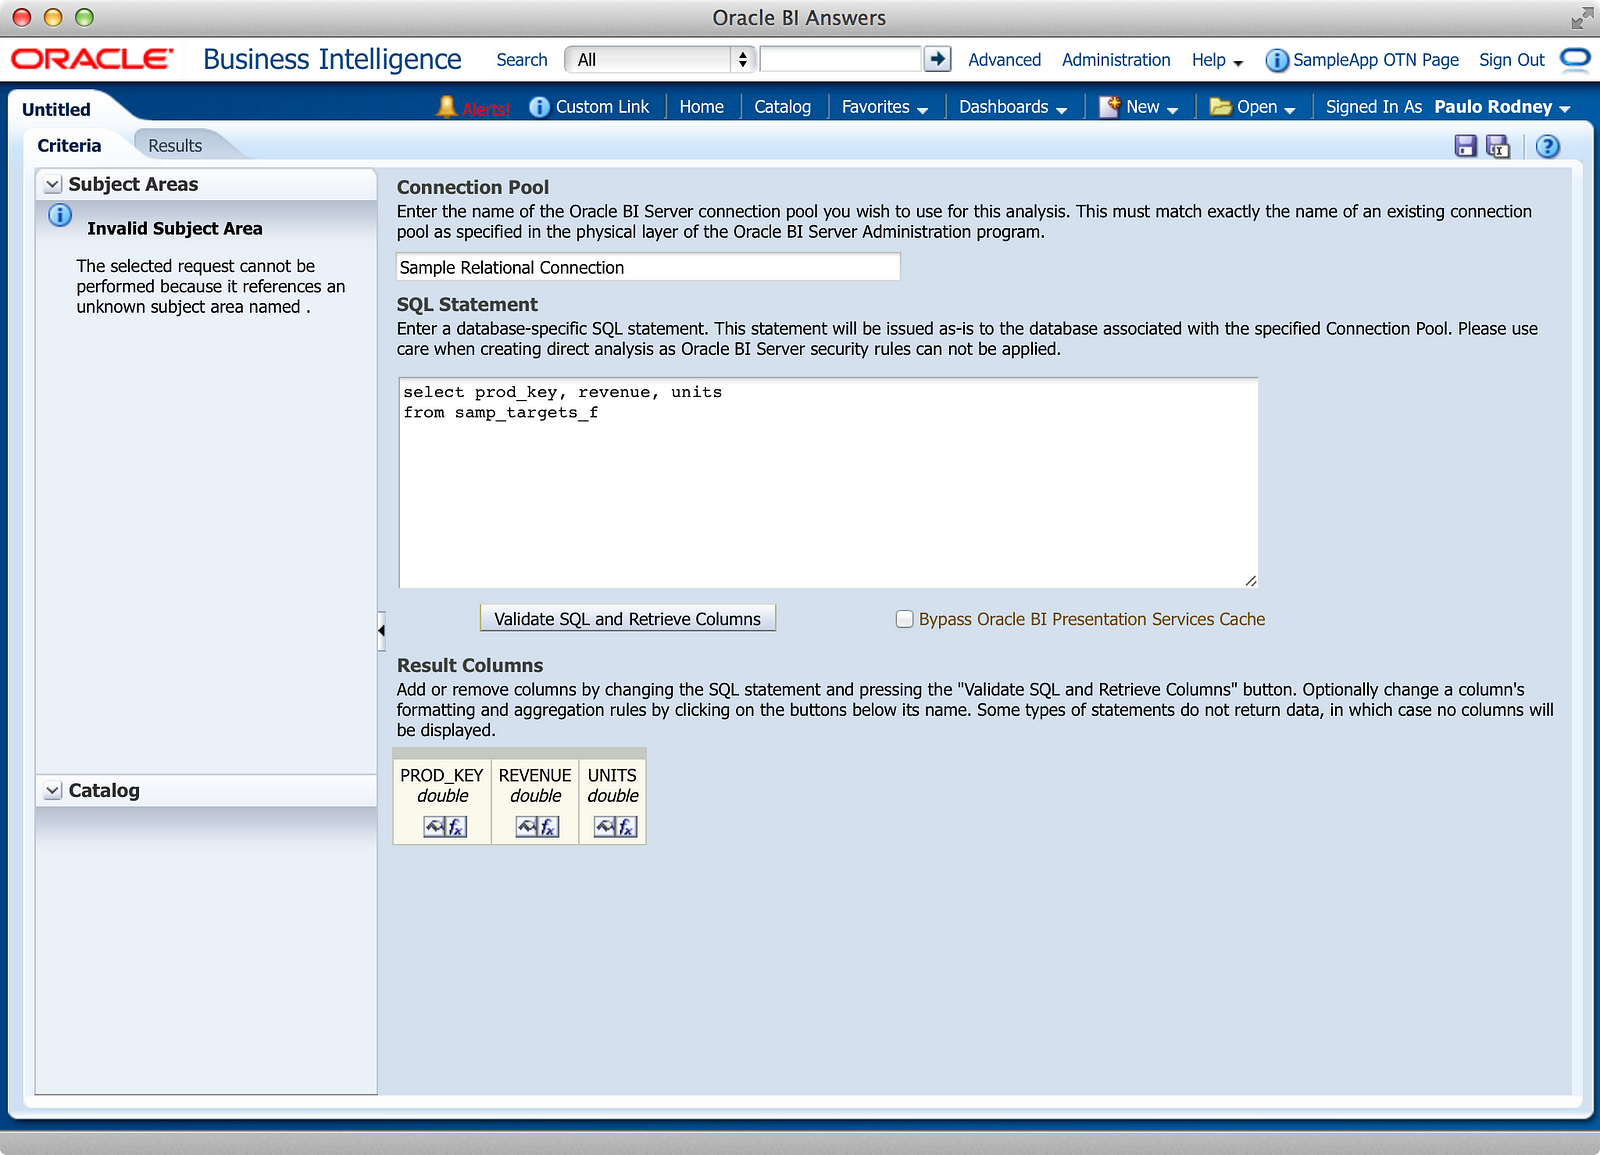
After the columns have been retrieved, we now have Criteria columns that any Analysis developer is used to seeing, with a few exceptions:
- The Result Columns have a distinctly “10g” look to them, using the older “finger pointer” and “fx” buttons for Column Properties and Edit Formula.
- There is no drop-down to apply sorts, filter, or delete the column.
- Even the “fx” button doesn’t actually allow you to construct a formula for the column. You can only set an aggregation rule. All formulas must be constructed in the SQL statement itself.
- There are no Filters and Selection Steps panes.
So while the Criteria tab is a bit different, since we’re not creating a logical query against the metadata layer, the Results tab looks very much the same, as shown below:
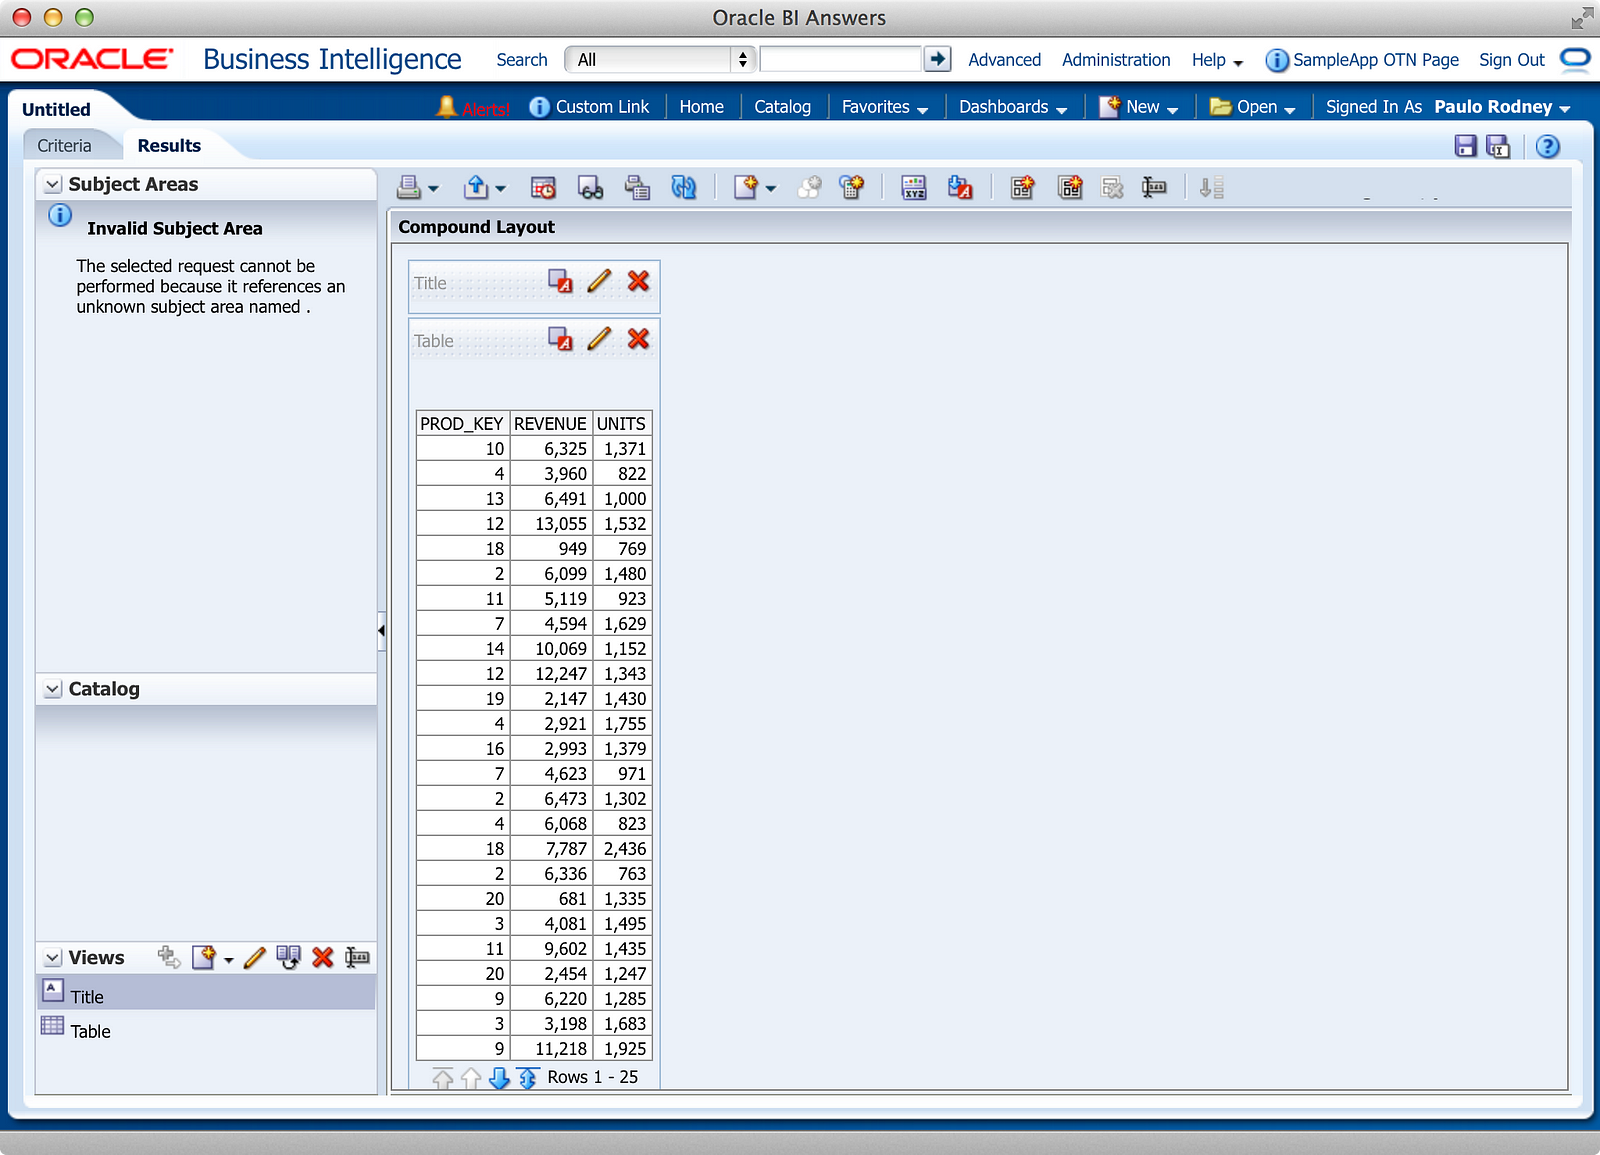
We still have a Compound Layout and various Views which can be assembled onto it. Notice there are no Prompts and Advanced tabs, though. This really emphasizes the specific use case for using DDR: Analysis developers used to building Compound Layouts can do so against Connection Pools without being forced to use a metadata layer. In Part 2, I’ll discuss some more practical use cases for this, but let’s continue with a few more observations about DDR functionality.
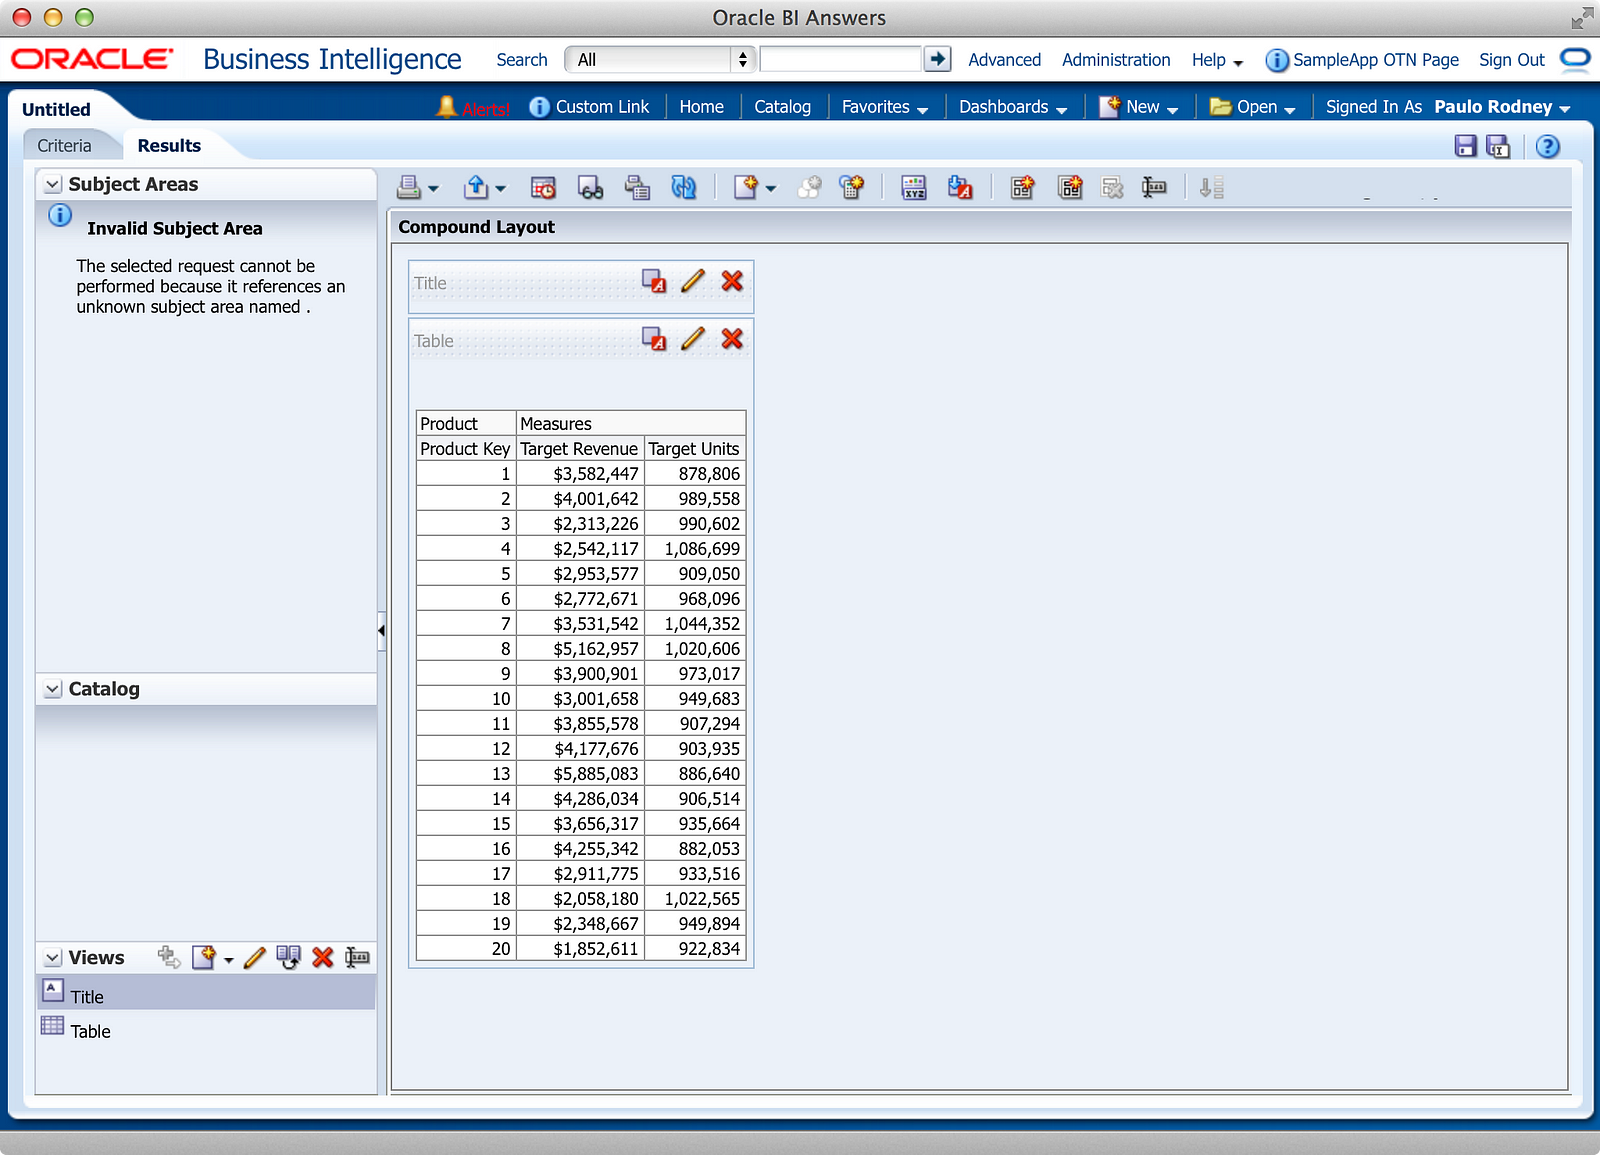
The screenshot above is a culmination of a few steps:
- I change the SQL from a detail listing (SELECT FROM) to a summary (SELECT FROM GROUP BY). Since the BI Server isn’t helping out here, you have to build your own summarization.
- I added an ORDER BY clause to sort the PROD_KEY.
- I used the Column Properties to rename the column and folder headings, added data formating to display currency and number formatting complete with currency symbols and commas.
- I edited the Table Properties to display the folder and column headings as separate rows.
While numbers 1 & 2 were manual steps I had to produce in the SQL statement itself, numbers 3 & 4 used standard Analysis functionality. Let’s take it a step further and produce a chart, shall we?
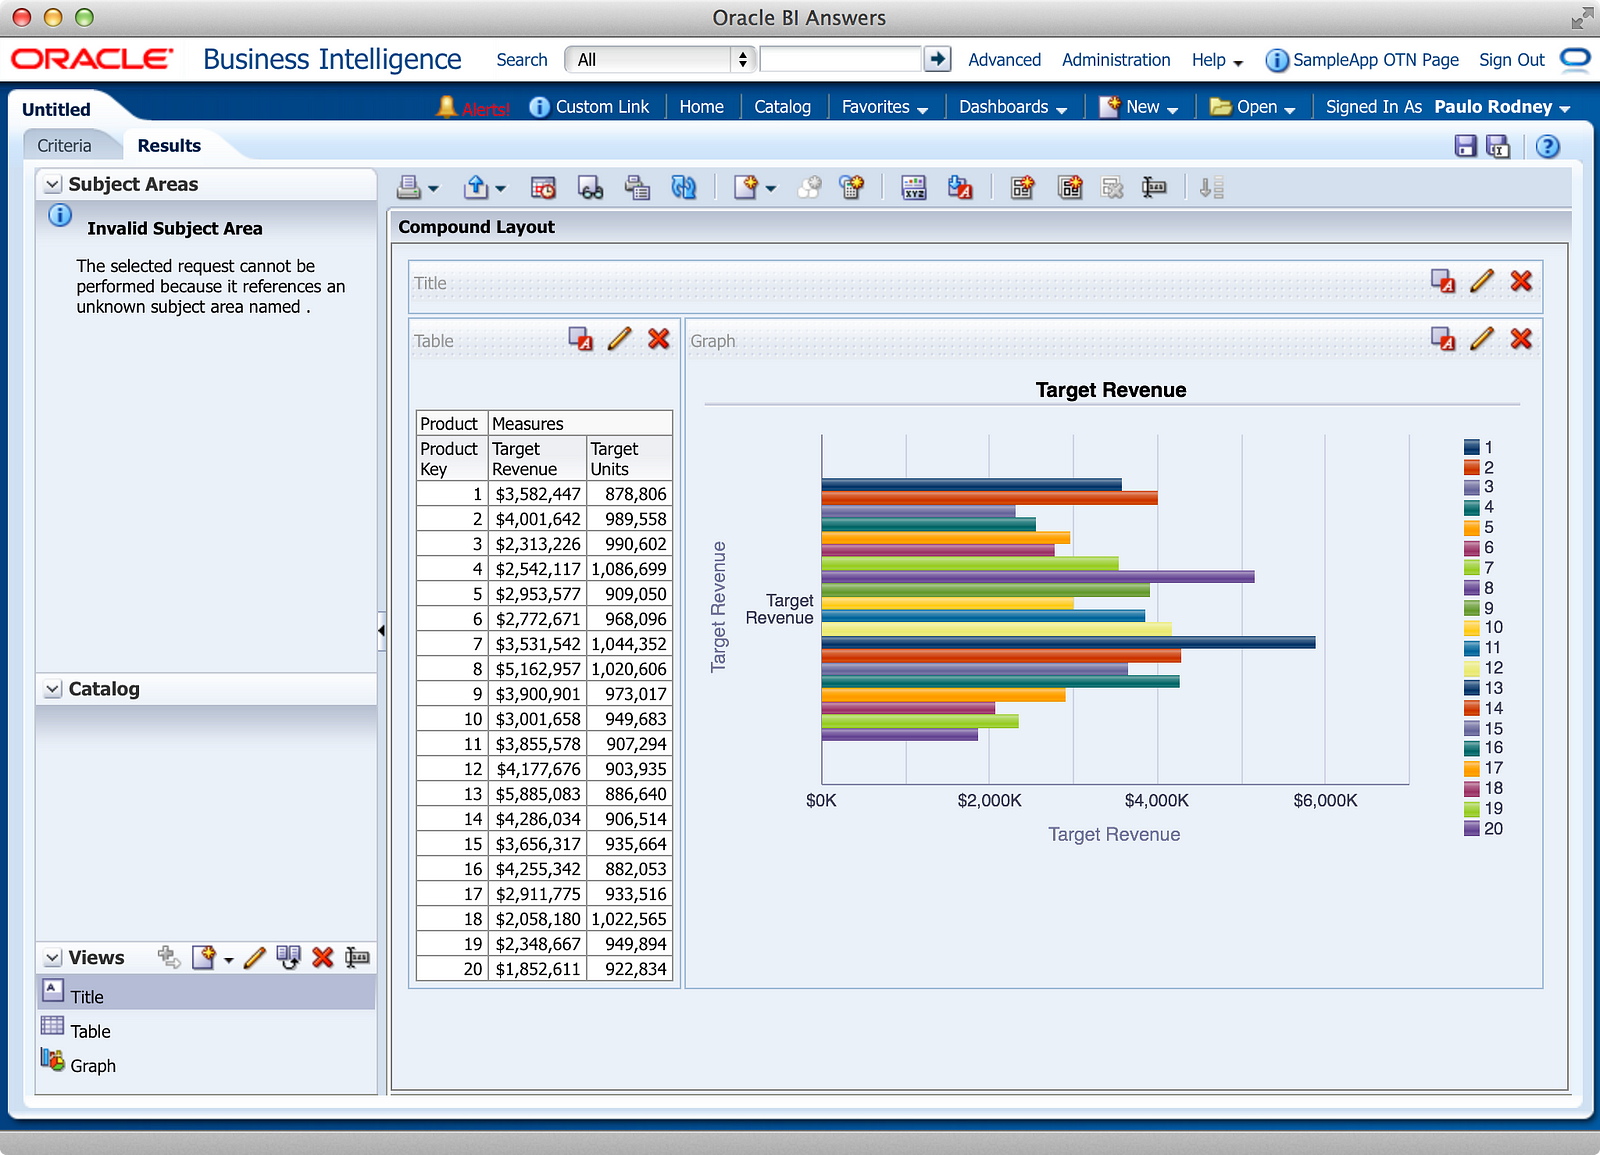
If you’re following along at home, there is one additional step you’ll need to produce this chart, because it won’t look like this when you first create it.
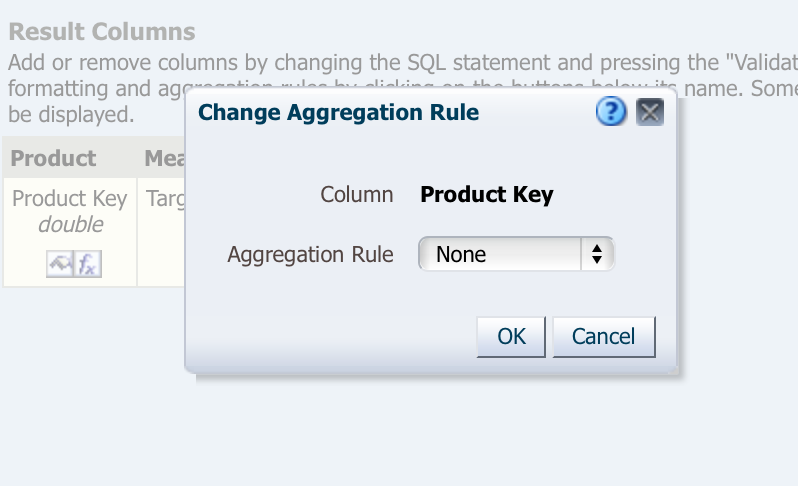
That step is to set the aggregation rule of PROD_KEY (or as named above “Product Key”) to None. For whatever reason, OBIEE assumes every column in a DDR request is a measure by default, and setting the aggregation rule to None tells OBIEE to use this column as an attribute. You’ll know you have done this step if your attribute column display with a yellow ruler icon in your chart layout editor, indicating a measure.
While Part 2 will include a number of tips for using DDR, let me impart this one particular tip upon you, in case you do not read Part 2: finalize your SQL query before you format your Result columns, Views and Compound Layout. Clicking the “Validate SQL and Retrieve Columns” button resets your Column Properties and Aggregation Rules, which can impact everything in the Analysis.
In Part 2 I’ll talk about how DDR works, the most likely use cases for using DDR, and a few tips for how you might want to implement it.