
If you’ve been following this series, you’ll know that in Part 01 of my day-in-the-life (DITL) I worked on getting my first data set loaded and in Part 02 I learned the ins-and-outs of loading additional data into the same table. In both articles, my data comes from Square, which is my wife’s POS system for her store. In Part 03, my plan is to take the table I have and turn it into a working OBIEE model using the new Data Modeler tool in Oracle BI Cloud Service (BICS), which replaces the Administration Tool in on-premise OBIEE. Let’s get started.
Before I do anything, I want to take a backup of the original system state so I can restore if needed. Fortunately, BICS makes this easy with a new feature called Snapshots which bundles the necessary OBIEE files into a single package that can be restored at any time.
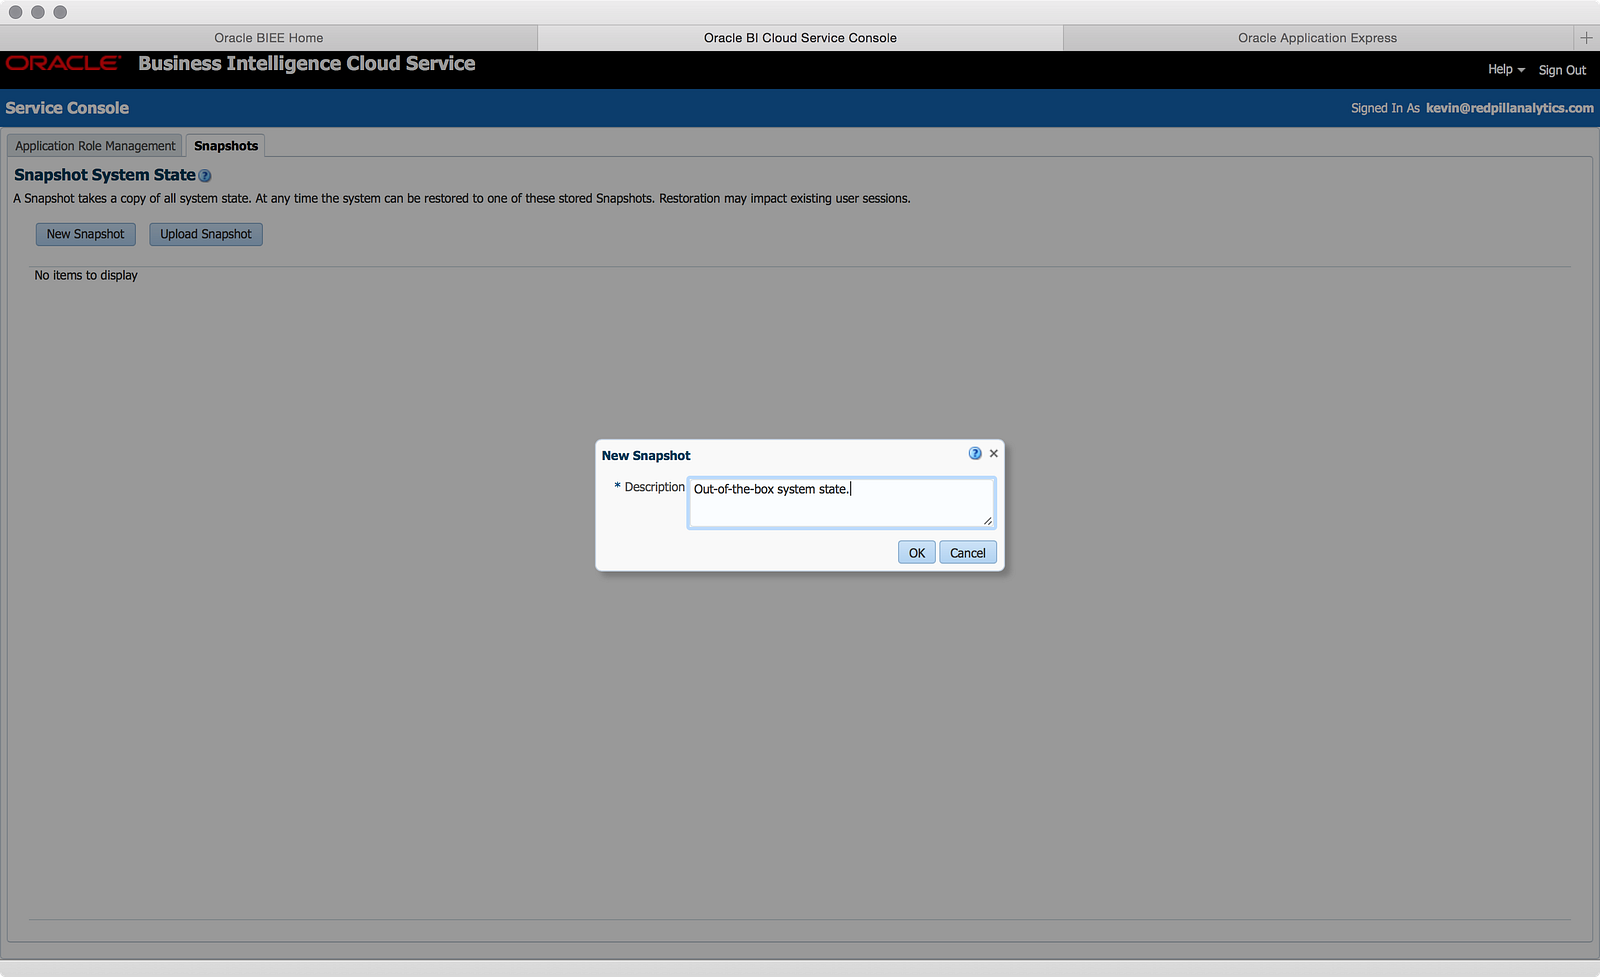
The Snapshot feature is available in the Service Console which can be accessed using the Manage link on the OBIEE home page. Creating a Snapshot couldn’t be easier and once you have a Snapshot, you can even download it, presumably to apply to another BICS environment: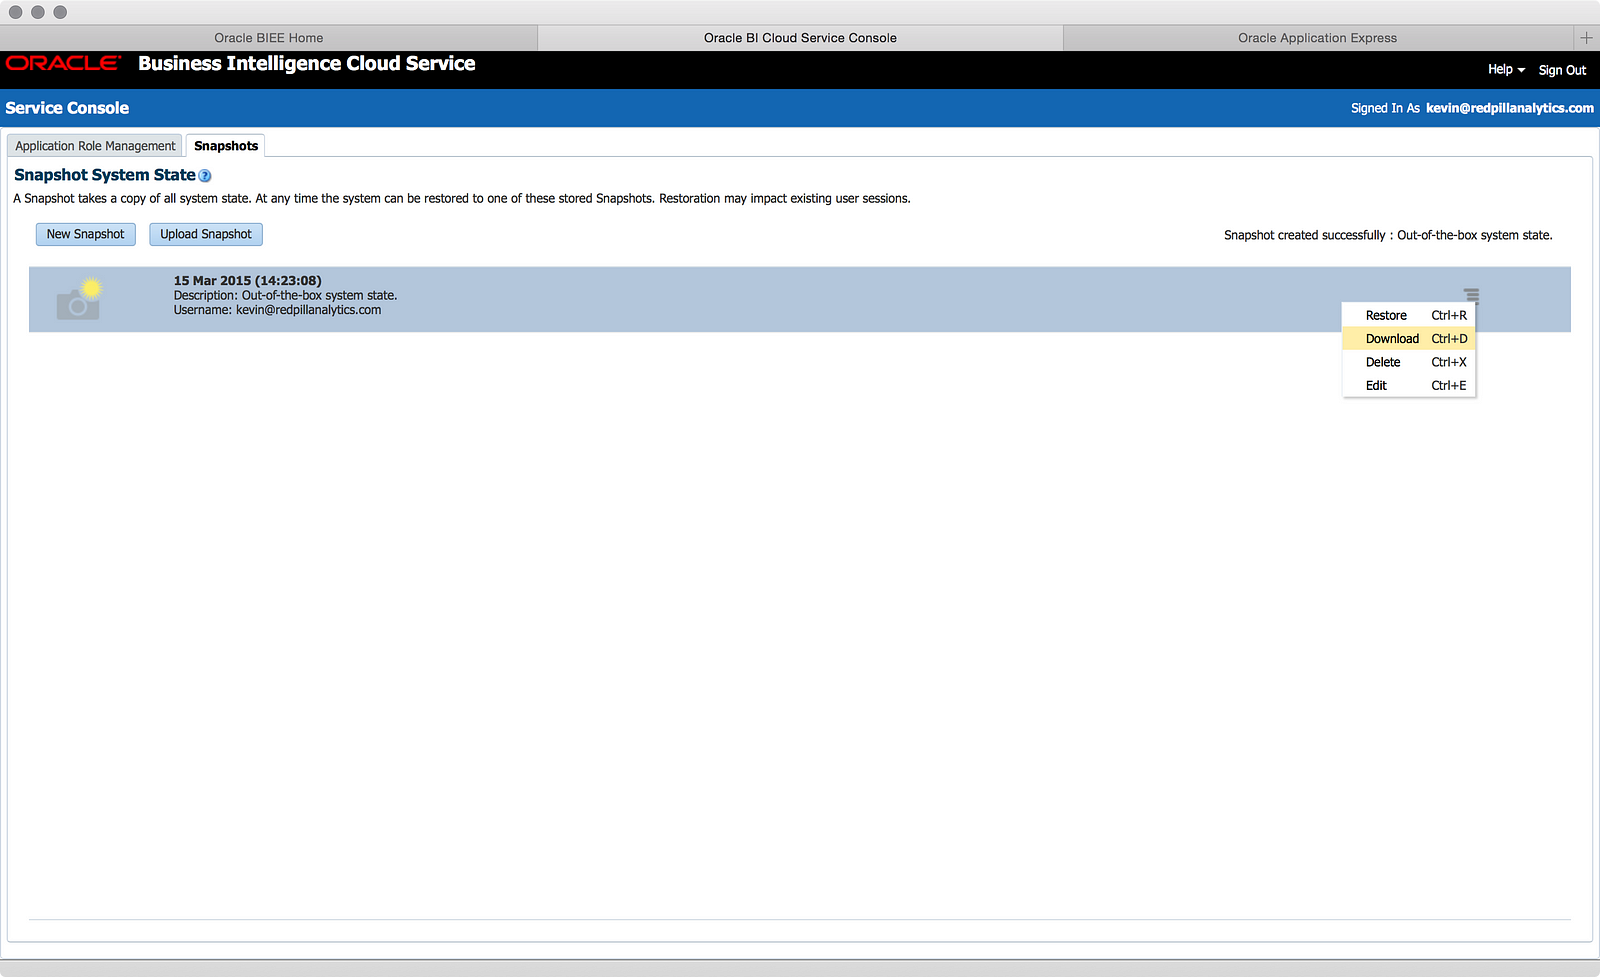
At this time you can’t apply a BICS Snapshot to an on-premise instance of OBIEE, but down the road this seems like it might be both desirable and possible. Additionally, I wouldn’t be surprised to see the Snapshot feature appear in on-premise OBIEE, with the ability to push on-premise developed Snapshots to BICS. Either or both of these directions seem a logical extension to both BICS and on-premise OBIEE to provide greater integration between the two.
Now that I have my system backed-up, let’s get onto modeling:
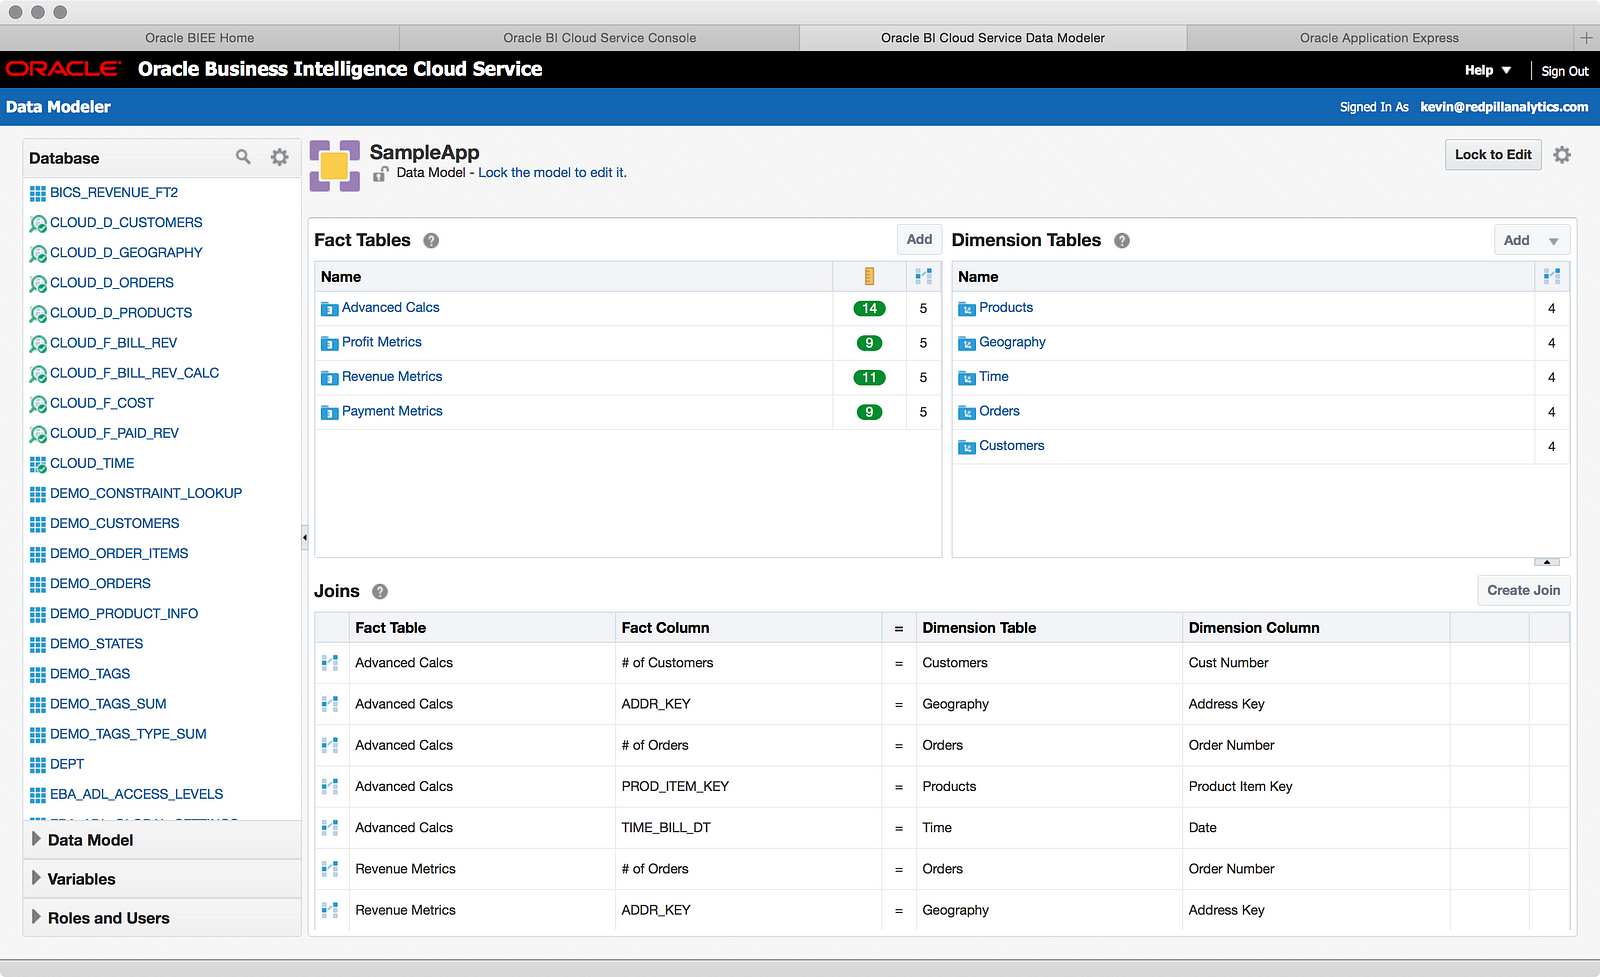
After entering the new Data Modeler tool from the OBIEE Home page, I literally sat and stared at it for a few minutes. This was both take in the pretty view (the Admin tool is quite ugly by comparison), but also frankly because I wasn’t sure where to start. With that in mind, here are a few notes about how BICS works:
- There is a fundamental limitation to the RPD in BICS (and yes, it is still a binary RPD file): you can only have one Subject Area at a time. You have to think of this less as an RPD modeling tool and more of a Subject Area modeling tool. You are building a Subject Area from a series of database tables/views, nothing more.
- You are effectively editing online. Similar to how you check-out objects when working in online mode, you have to “lock” the model in BICS to be able to edit it. Unlocking the model (or checking-in and saving) makes your changes available to the front-end. It’s not exactly the same as online editing of the RPD, but it’s more similar to online than offline. You don’t deploy an RPD file using Enterprise Manager.
- Because you are effectively working online, there is no “new RPD” or “import metadata” step. If you want to dramatically shift your model from one set of data to another (as I am about to do), you basically have to delete everything and start over. This makes the Snapshot step I performed above that much more important.
- Dramatically changing your model doesn’t change the fact that you have objects in your catalog depending on that model. Those analyses, prompts, and dashboards will break, regardless of whether you change the model (Subject Area) name or not. This means that you’ll want to go edit your catalog after editing your model to remove stale items. This is also why Oracle gives you both a Dev/Test environment (domain) of BICS and a Prod domain.
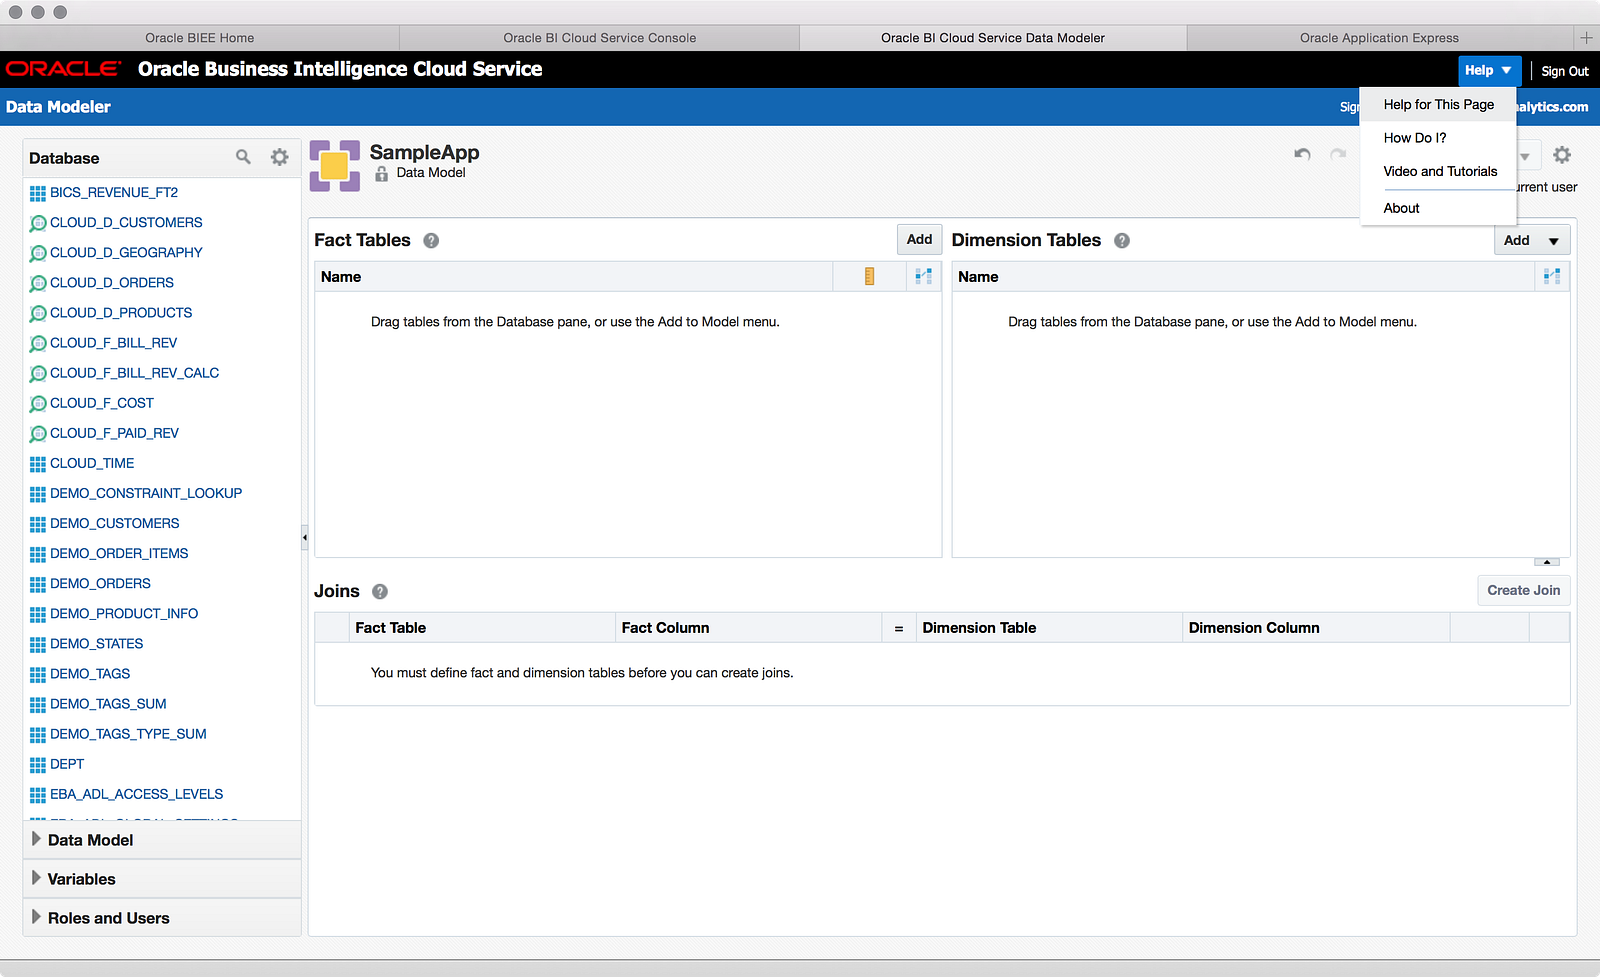
As you can see in the screenshot above, I deleted everything in the SampleApp model to begin with a clean slate. Note that this required me to delete certain things before others, as joins between Facts and Dimensions prevents you from deleting the table option before deleting the join. But now that I’m at a blank slate, now what? I turned to the help system to see if that could give me direction on getting started and I was curious if the documentation was different than on-premise OBIEE.
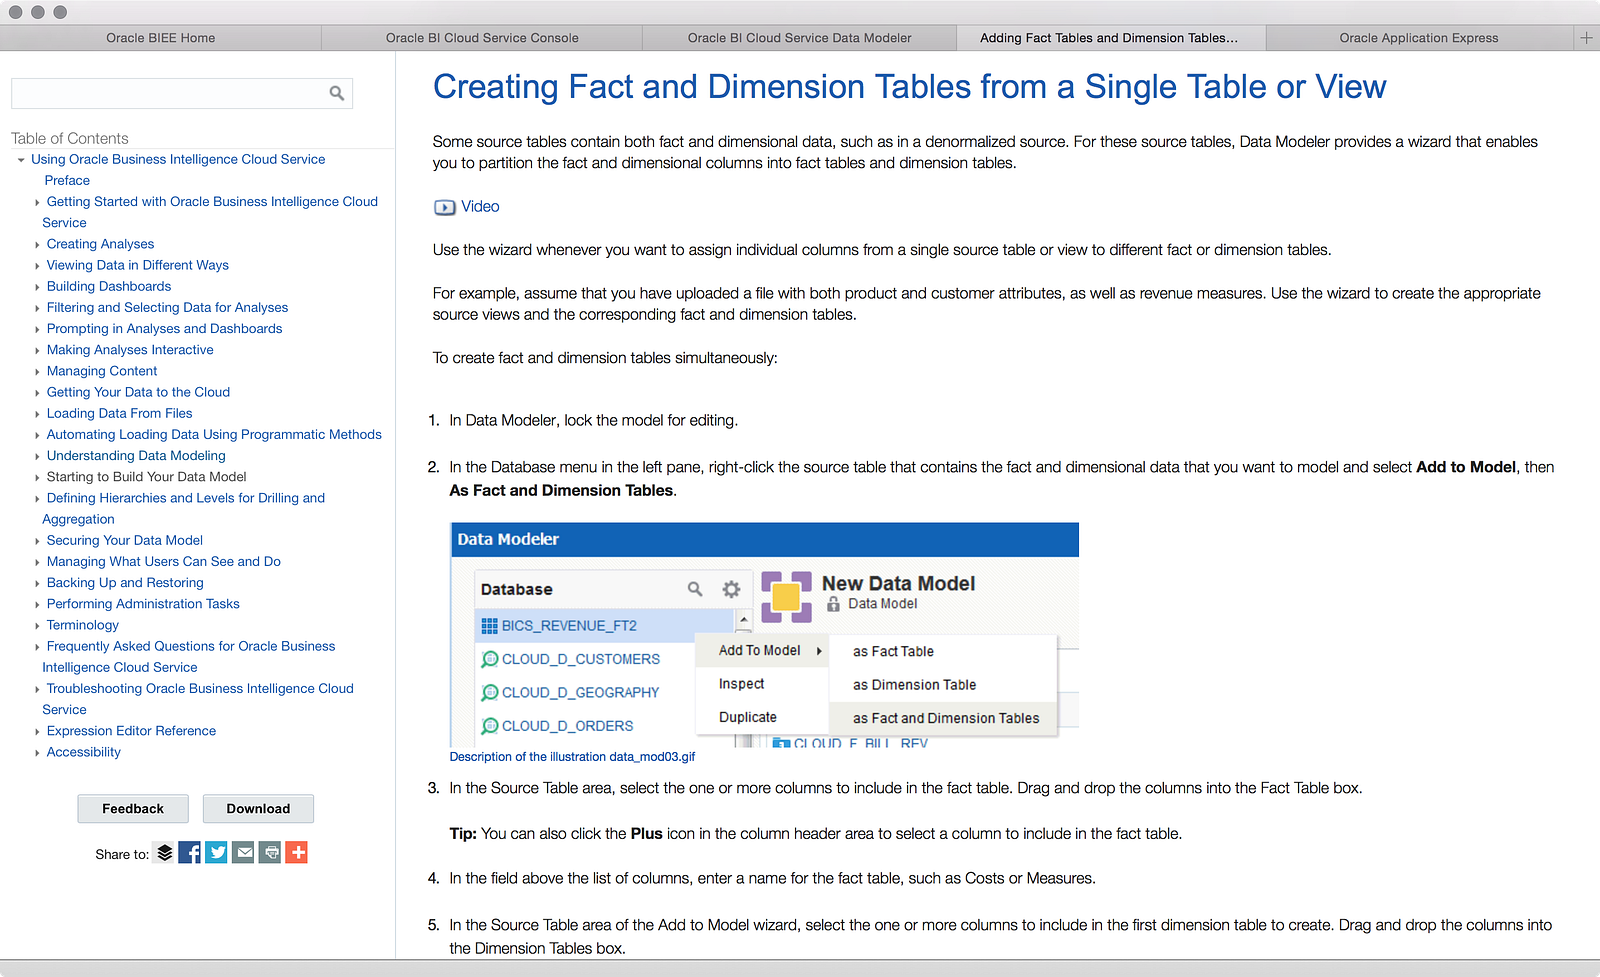
As it turns out, the help system is a bit nicer than your average Oracle documentation. There are linked videos to help you out and generally speaking, fewer available options in BICS means that the documentation can guide you more successfully because there are only so many paths you can take. In this case, I was able to find that there is a good option for building a full model from a single table, and so I pursued that path:
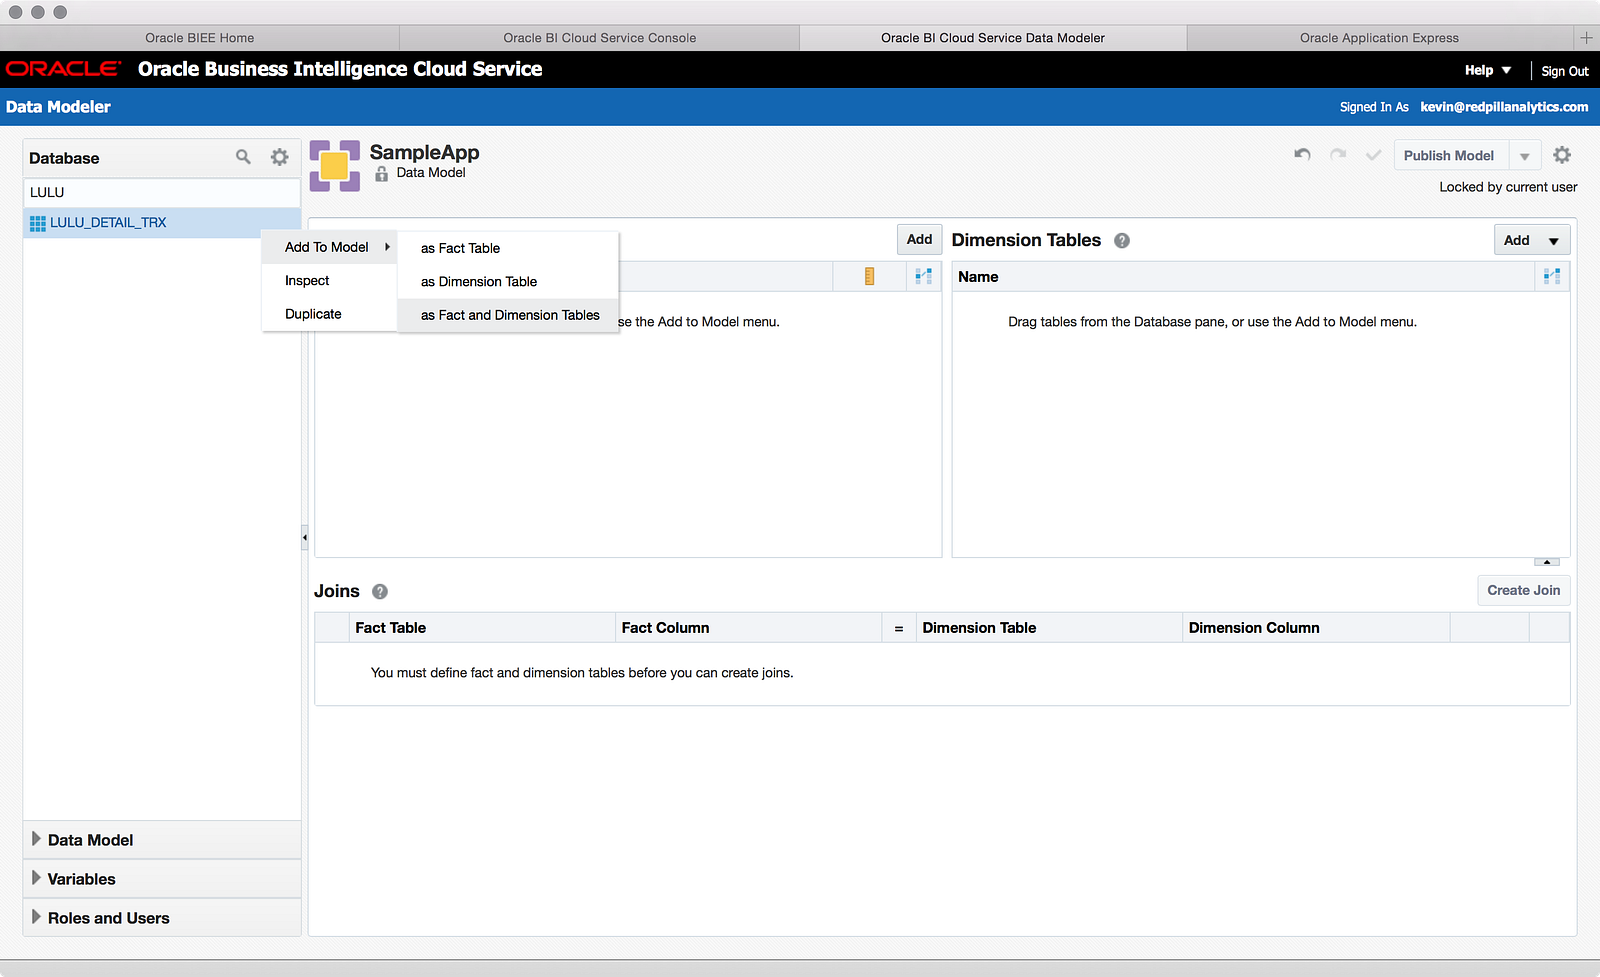
While the database can get a little crowded with tables and views, the search bar allowed me to get to my table quickly (table naming conventions will be valuable here). From there, a simple right-click started me down the path of adding it to my model:
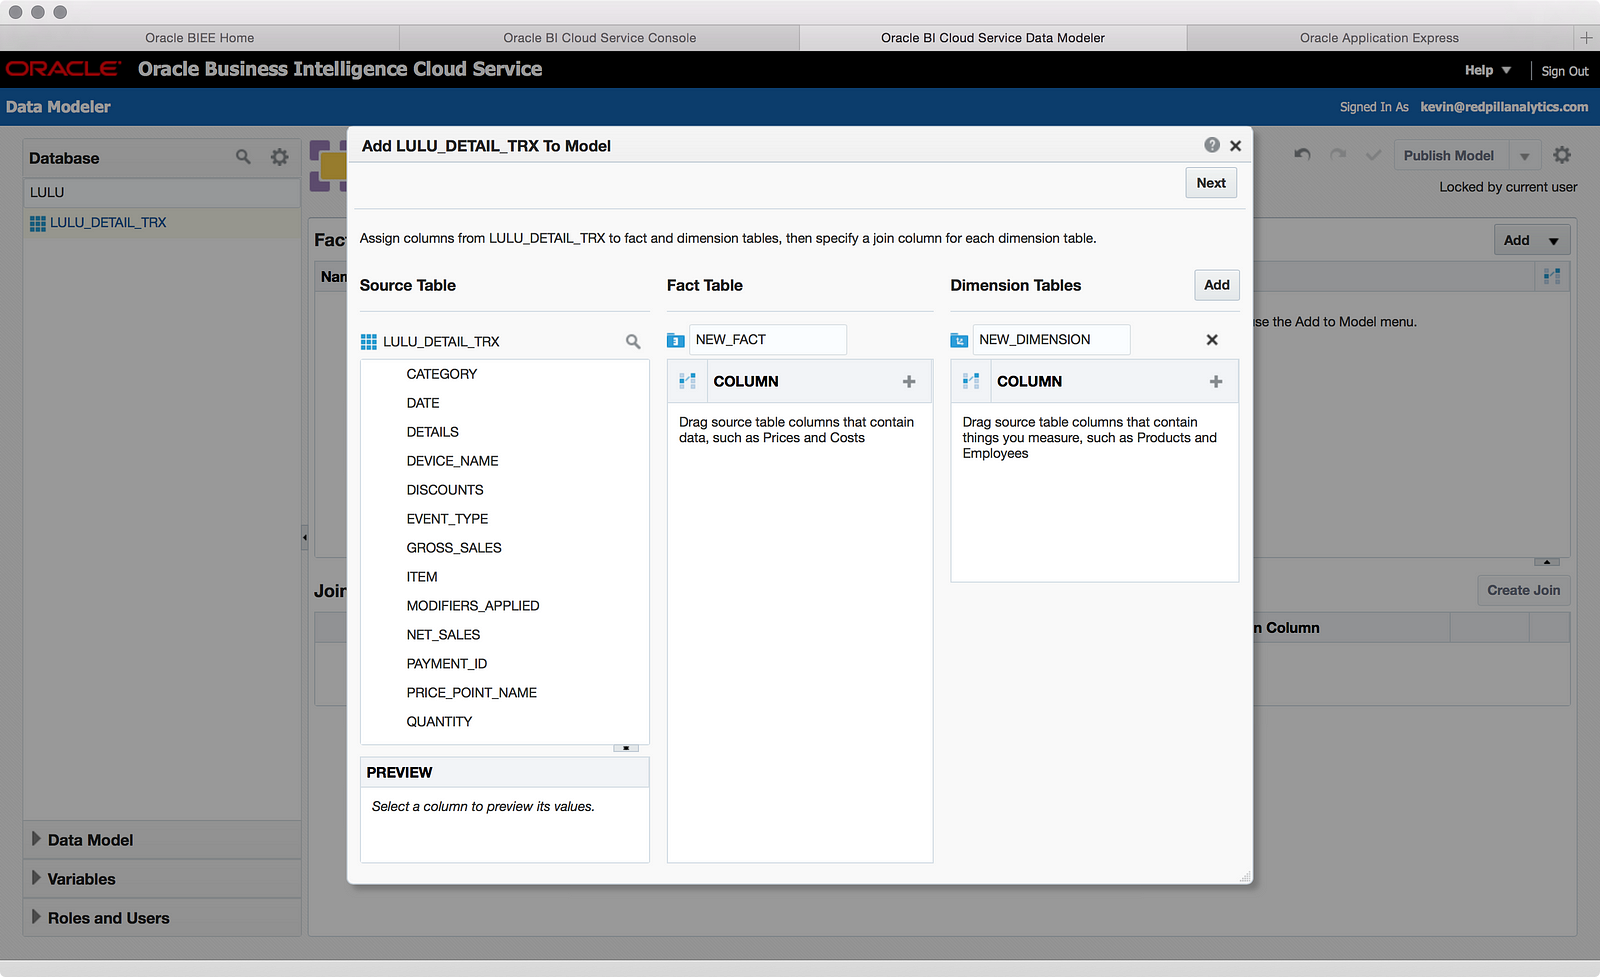
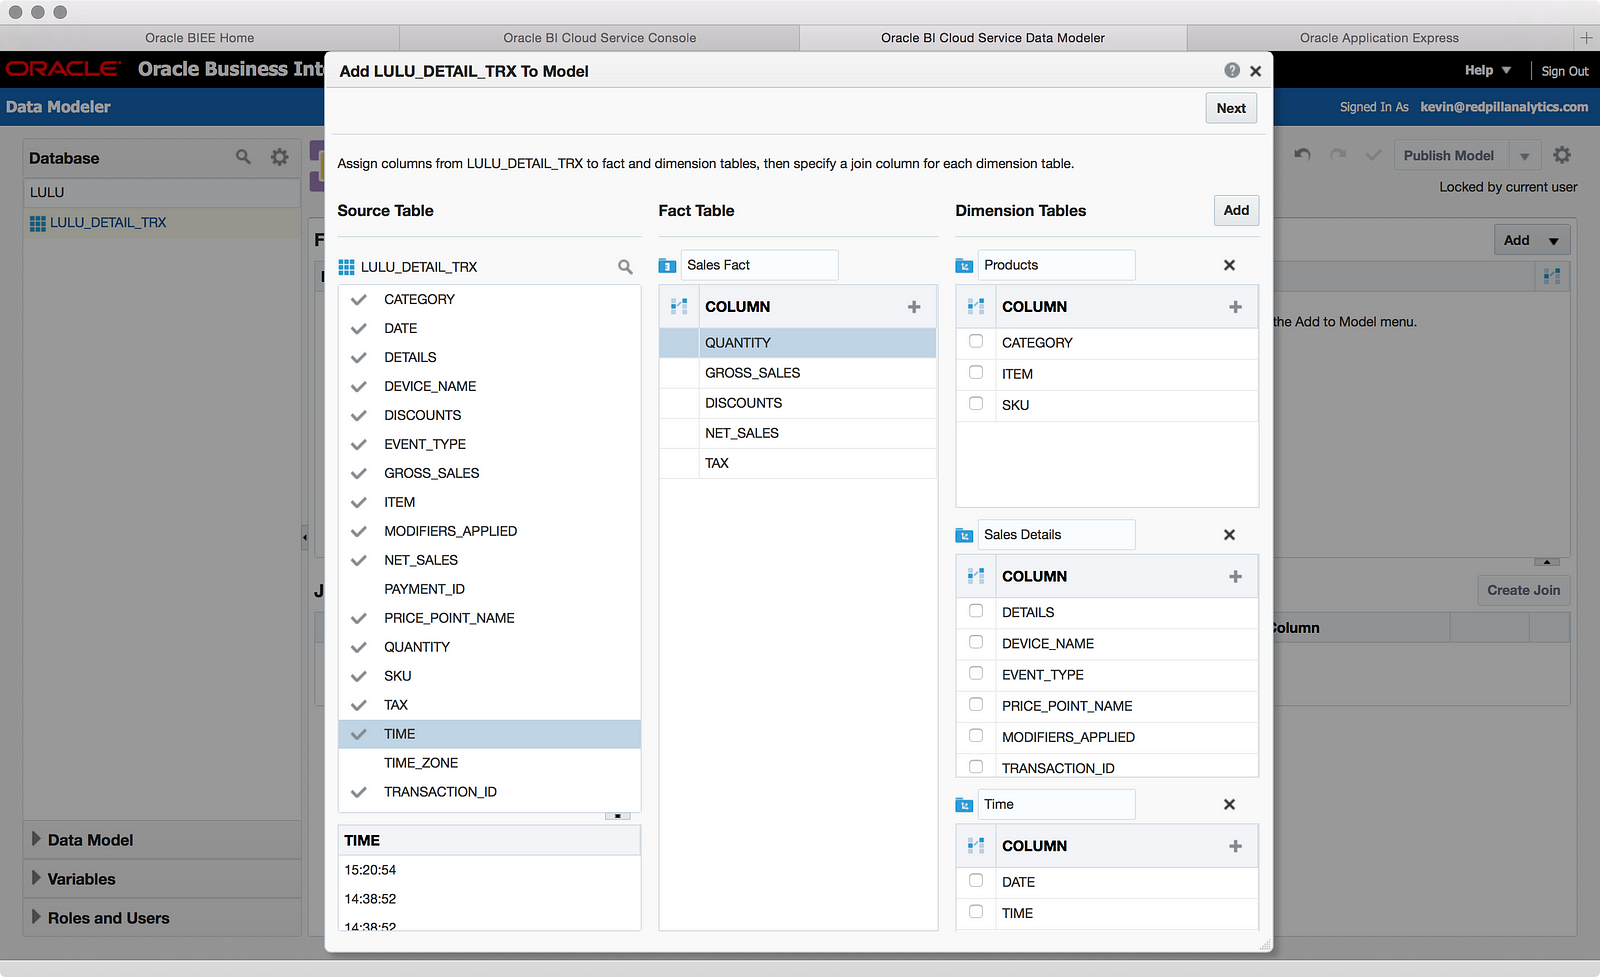
The window for starting the model is pretty self explanatory if you understand the concept of Facts and Dimensions. Using columns in my table, I was able to knock-out a model pretty quickly by dragging columns around and defining multiple dimensions:
Nice. Feeling all proud of myself, I clicked the Next button and voila:
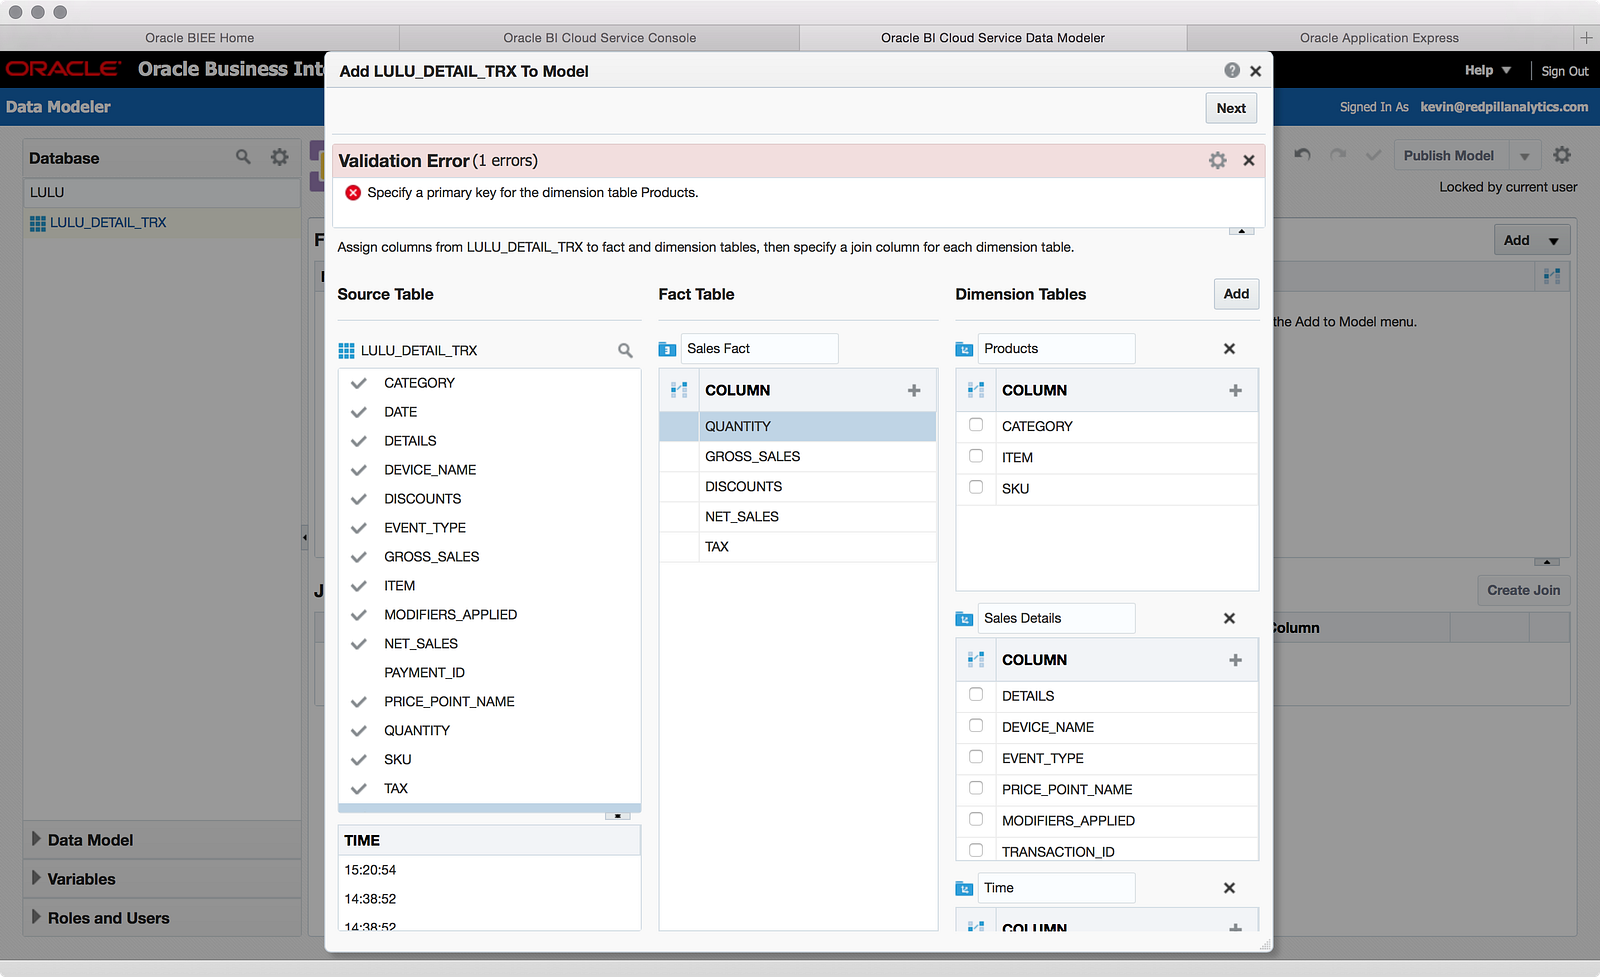
Nothing like getting an error on the first page! Had I read the directions more closely, though, I would have seen I need to define keys for my dimensions (duh!), which I quickly did:
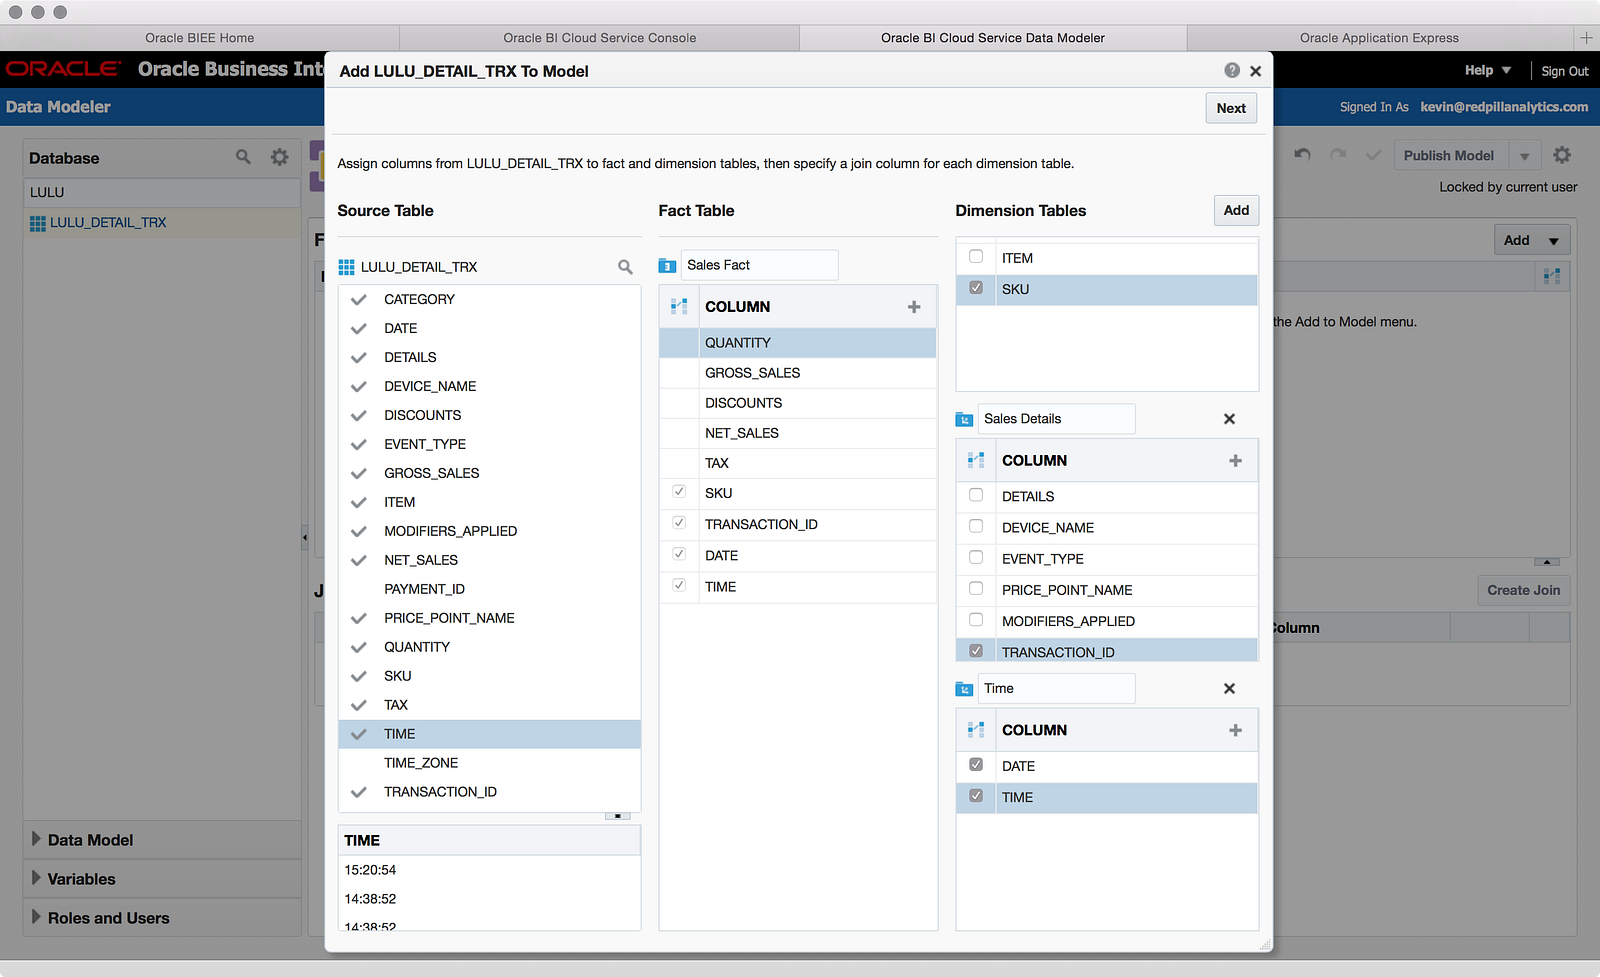
At this point, I actually have no idea whether these keys are right, whether I can have concatenated keys (as I defined in Time), etc. We’ll see what problems I run into later. Also, I should point out the UI for this screen is a little difficult, as the scrolling mechanism for scrolling through many dimensions doesn’t work smoothly, so be careful of that. Now let’s click Next again:
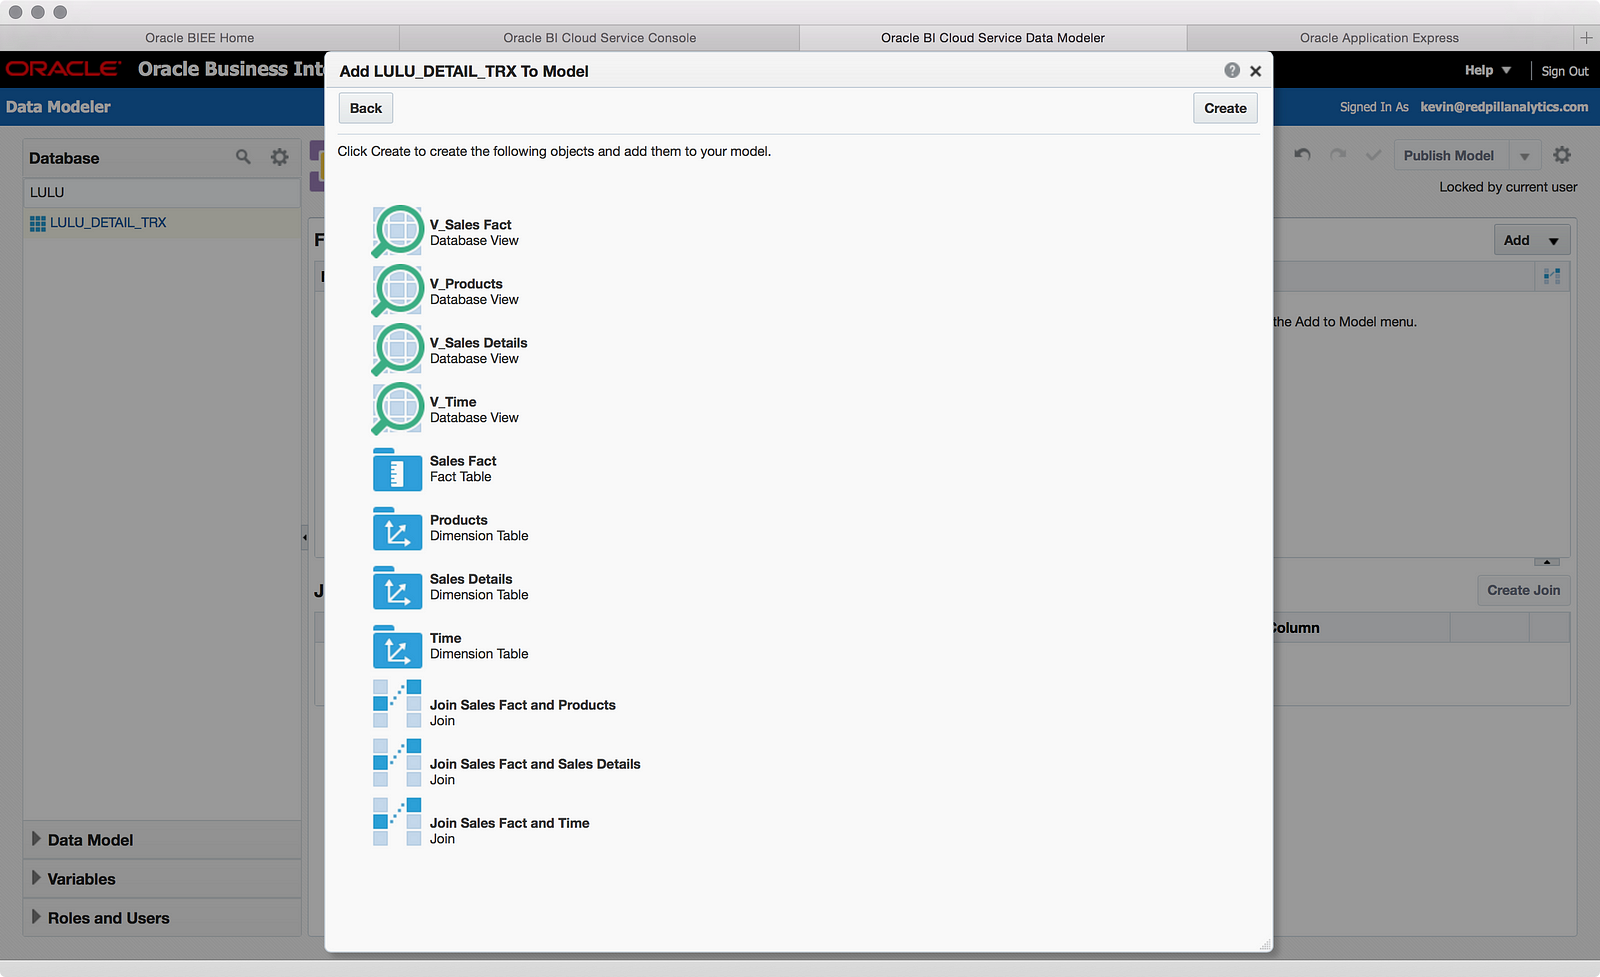
Interesting. This screen tells me that the Data Modeler is going to create database views, logical tables, and joins. The database view is interesting, because this tells me that the data modeler can’t create some of the more sophisticated RPD models for single file sources — it needs database views. I wonder if I should have just created the views myself before starting? Time will tell. Let’s create these objects:
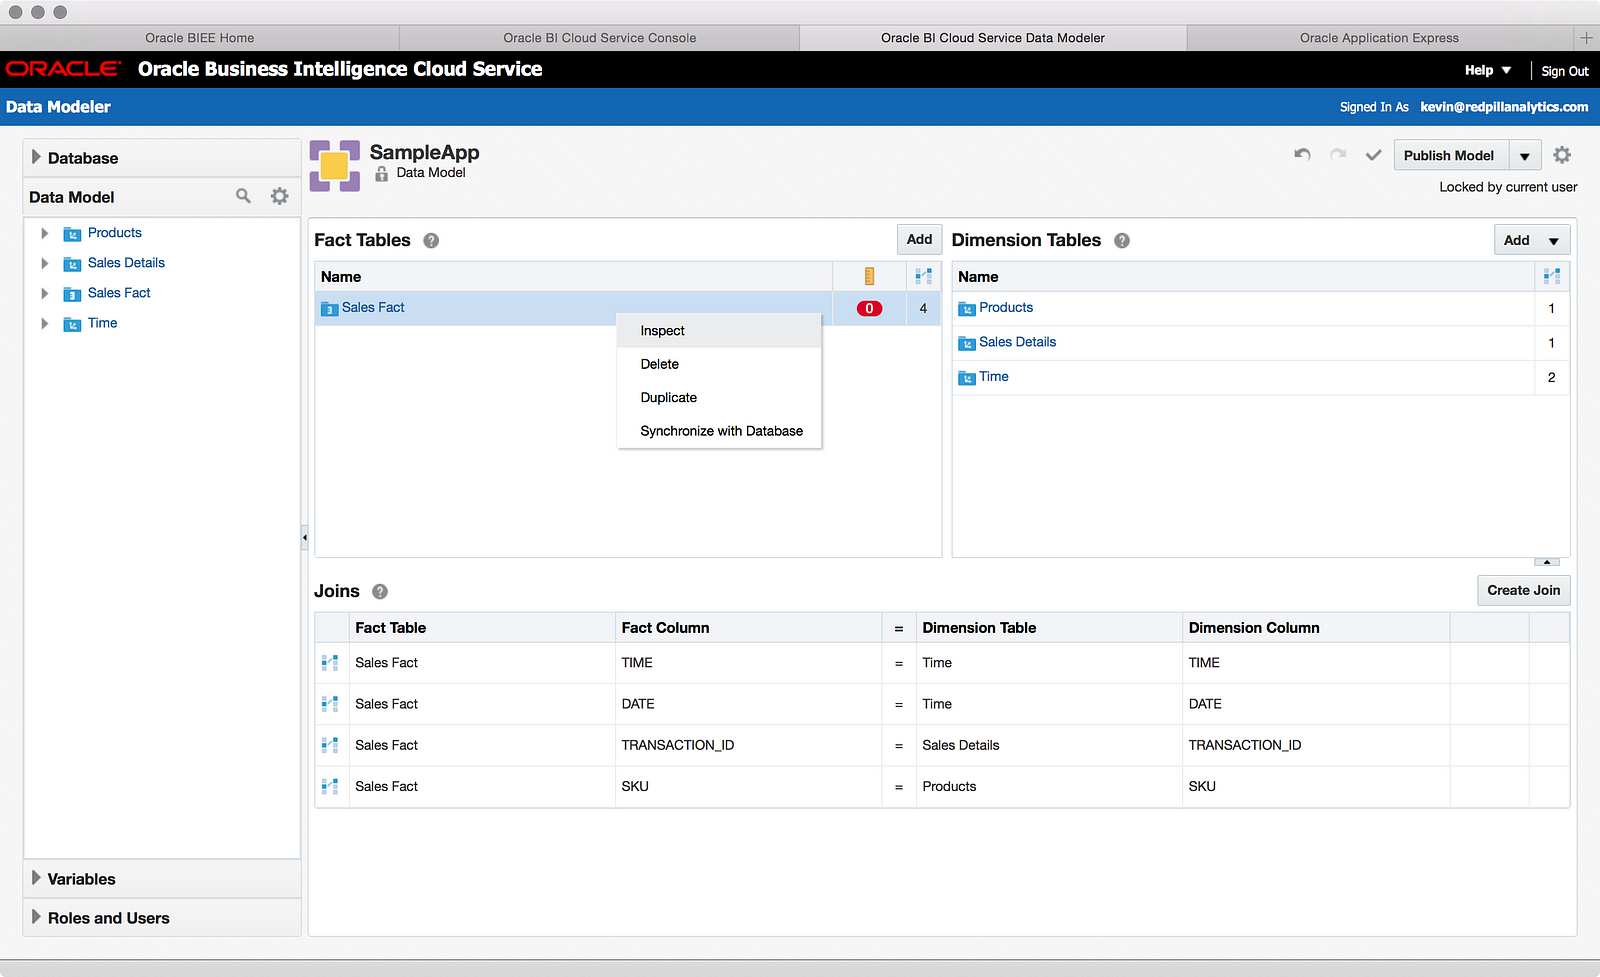
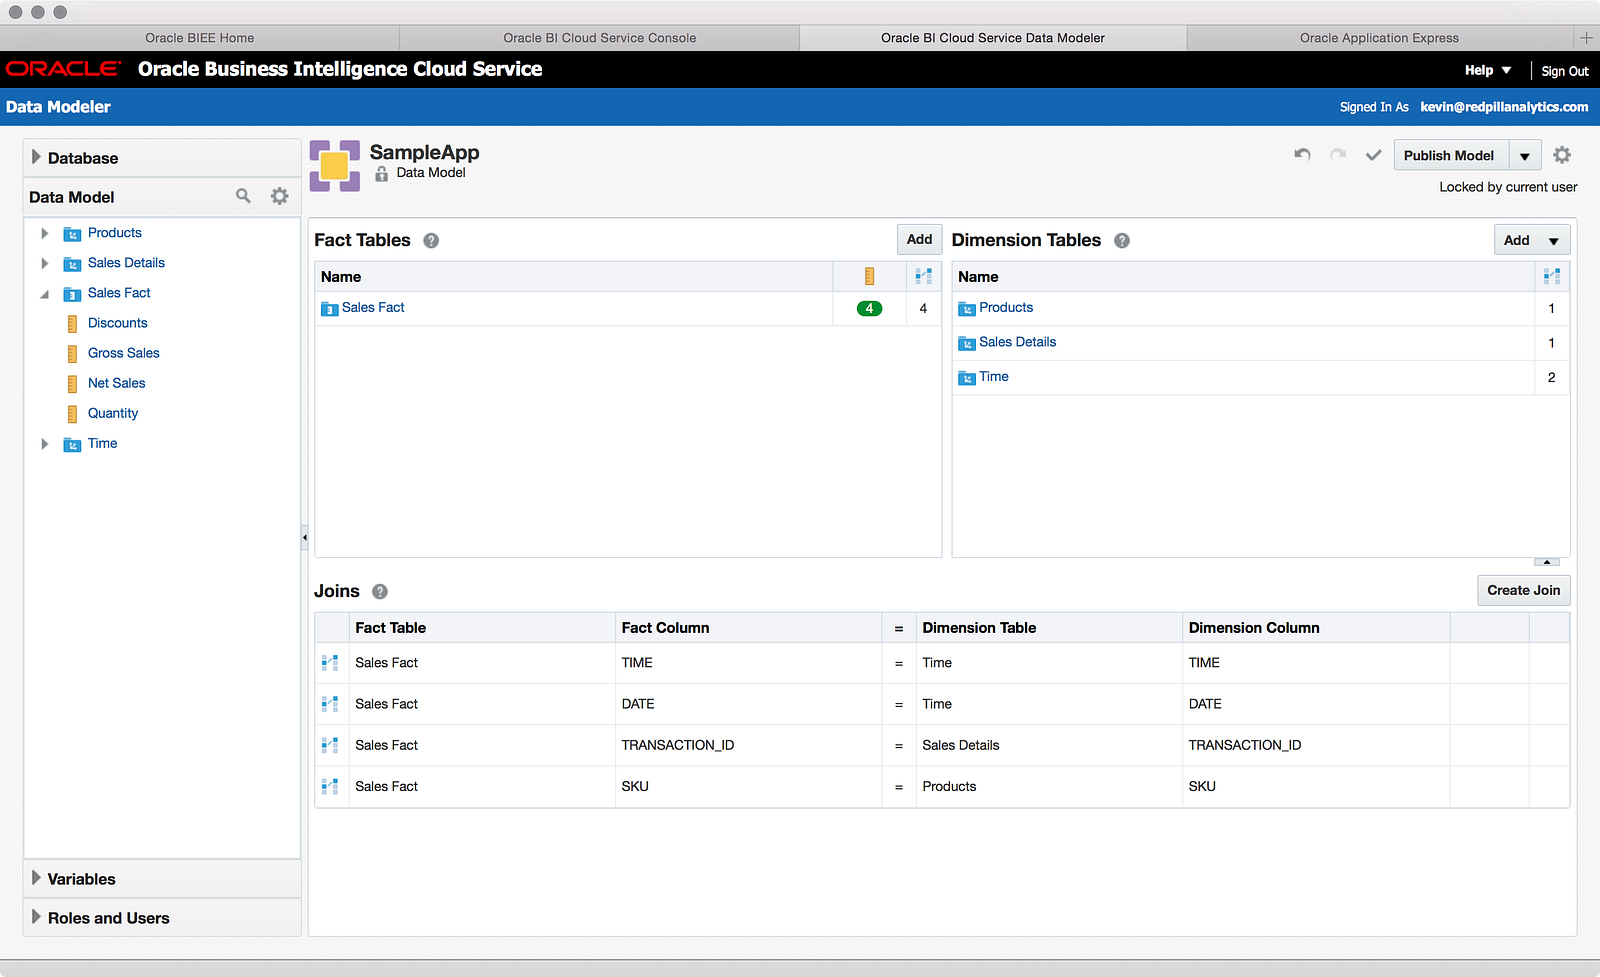
Above you can see my resulting model, and the bright red zero icon calls my attention to something I probably need to do yet, so I use my right-click to Inspect the “Sales Fact” table.
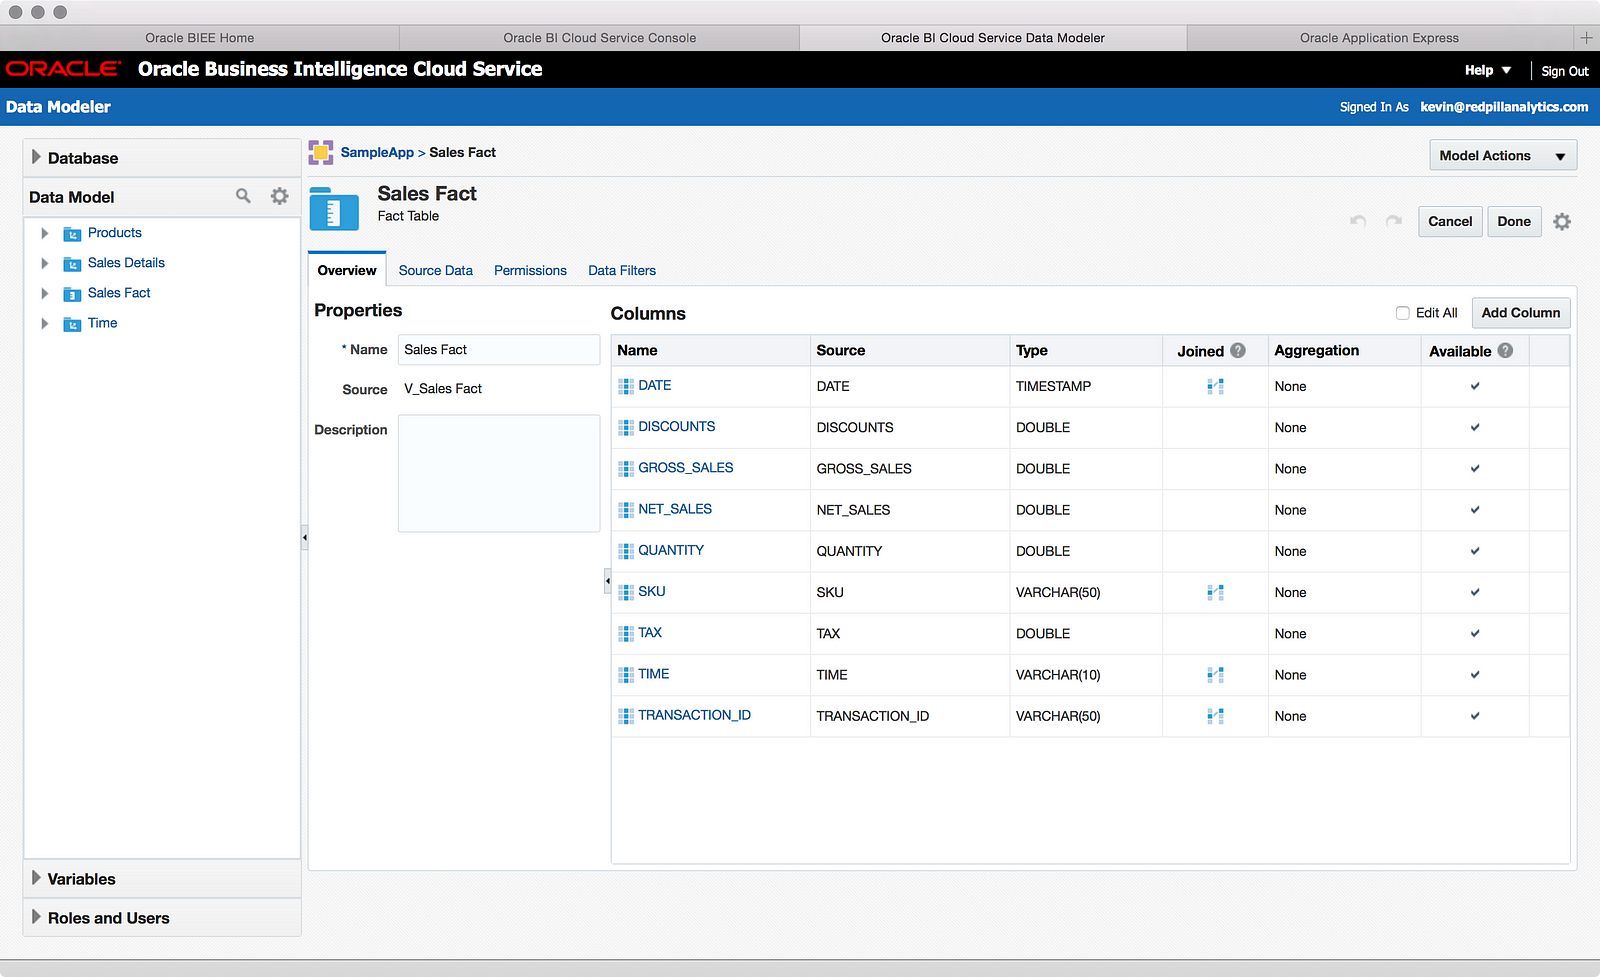

I’m not going to go into everything I can do here, but a close inspection of the screenshot above should inform the educated OBIEE reader that I can configure many of the things I’m used to doing in an RPD: names, descriptions, permissions, data filters, aggregation rules, hiding columns, and adding new calculated columns. This isn’t a complete list, but it represents most of the things you’d expect to do in a Fact table.
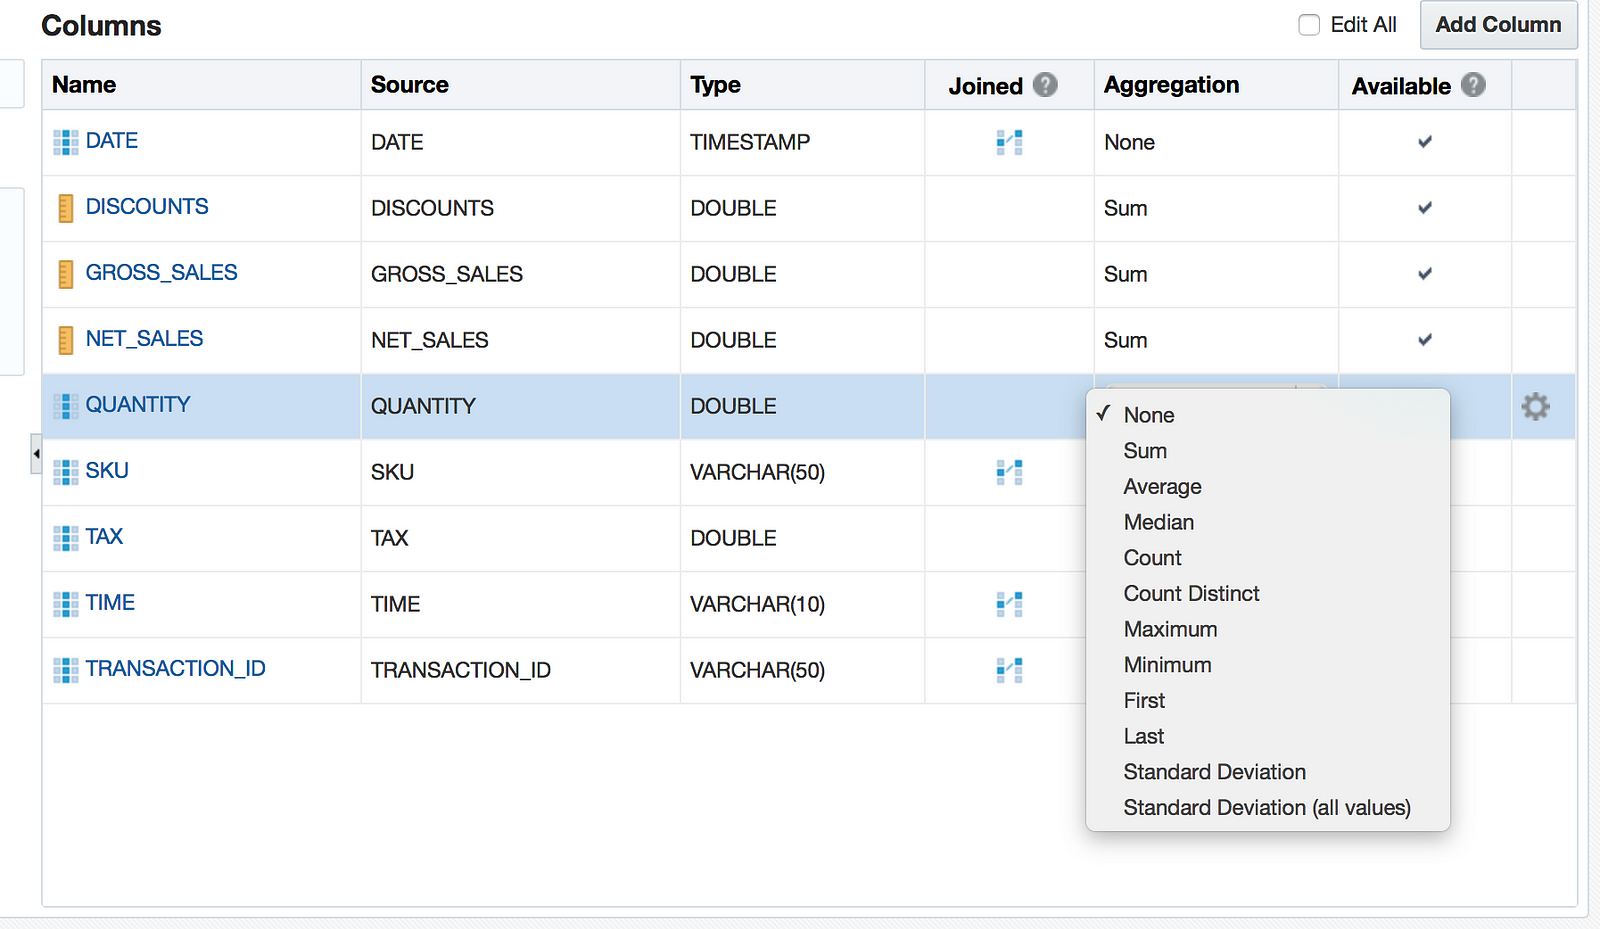
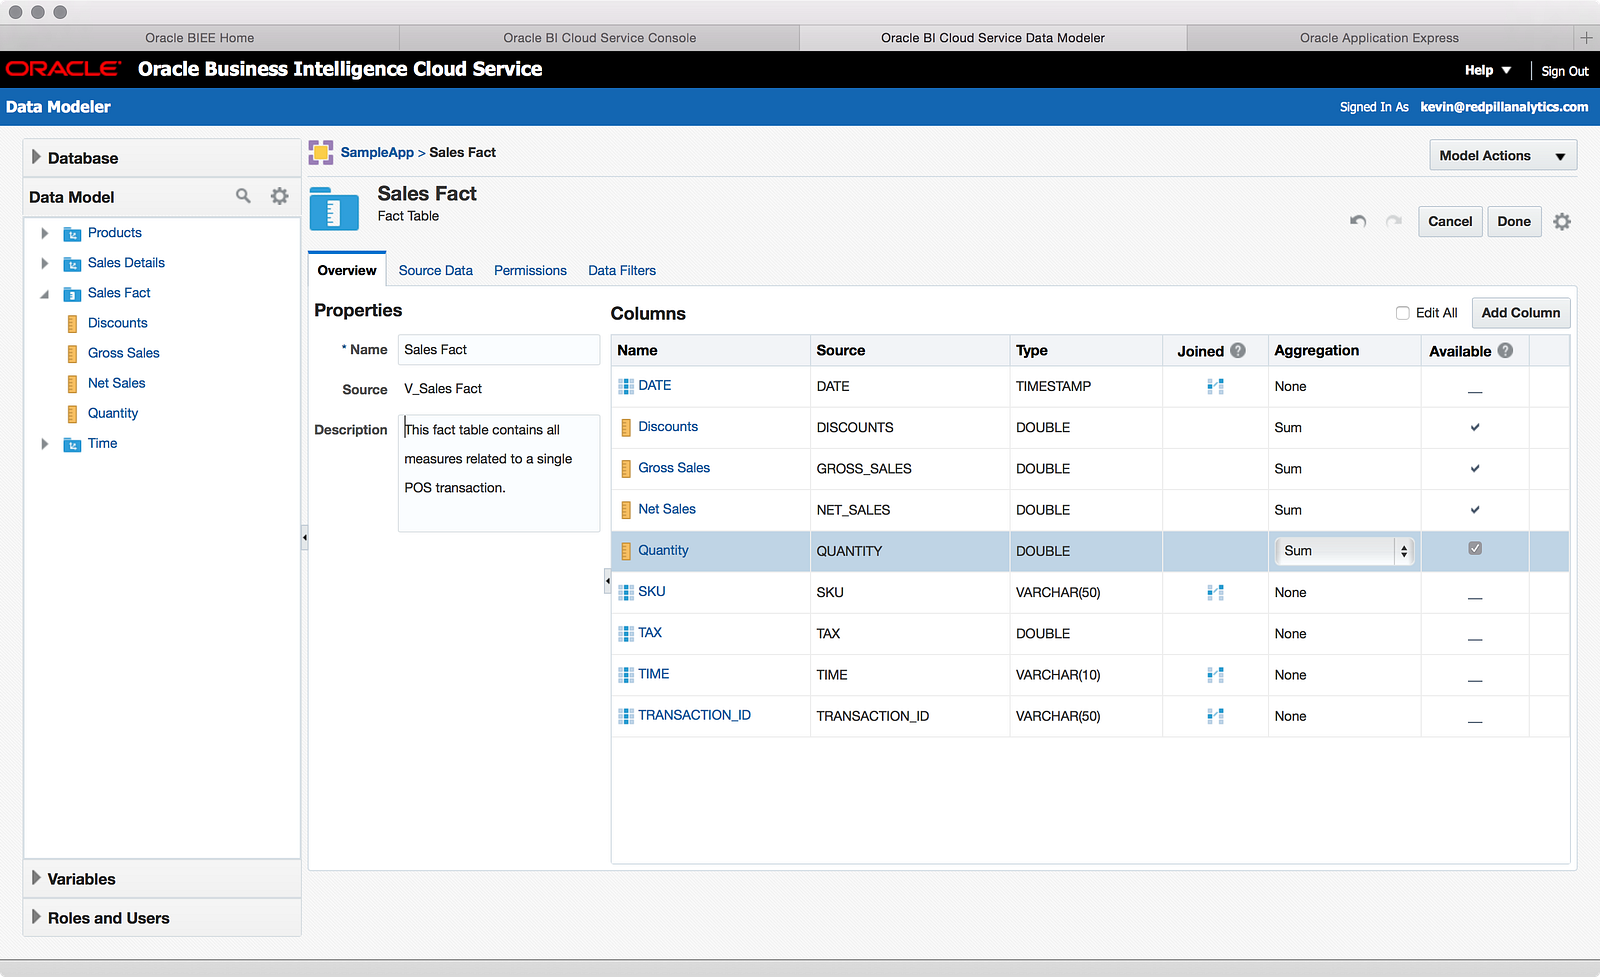
The Data Modeler wanted me to define some actual facts with aggregation rules, which I was happy to comply with. I also went ahead and renamed the measures and hid the key columns and clicked Done:
Since I took a spin through what I can do with a fact table, it only made sense to do the same with the dimensions:
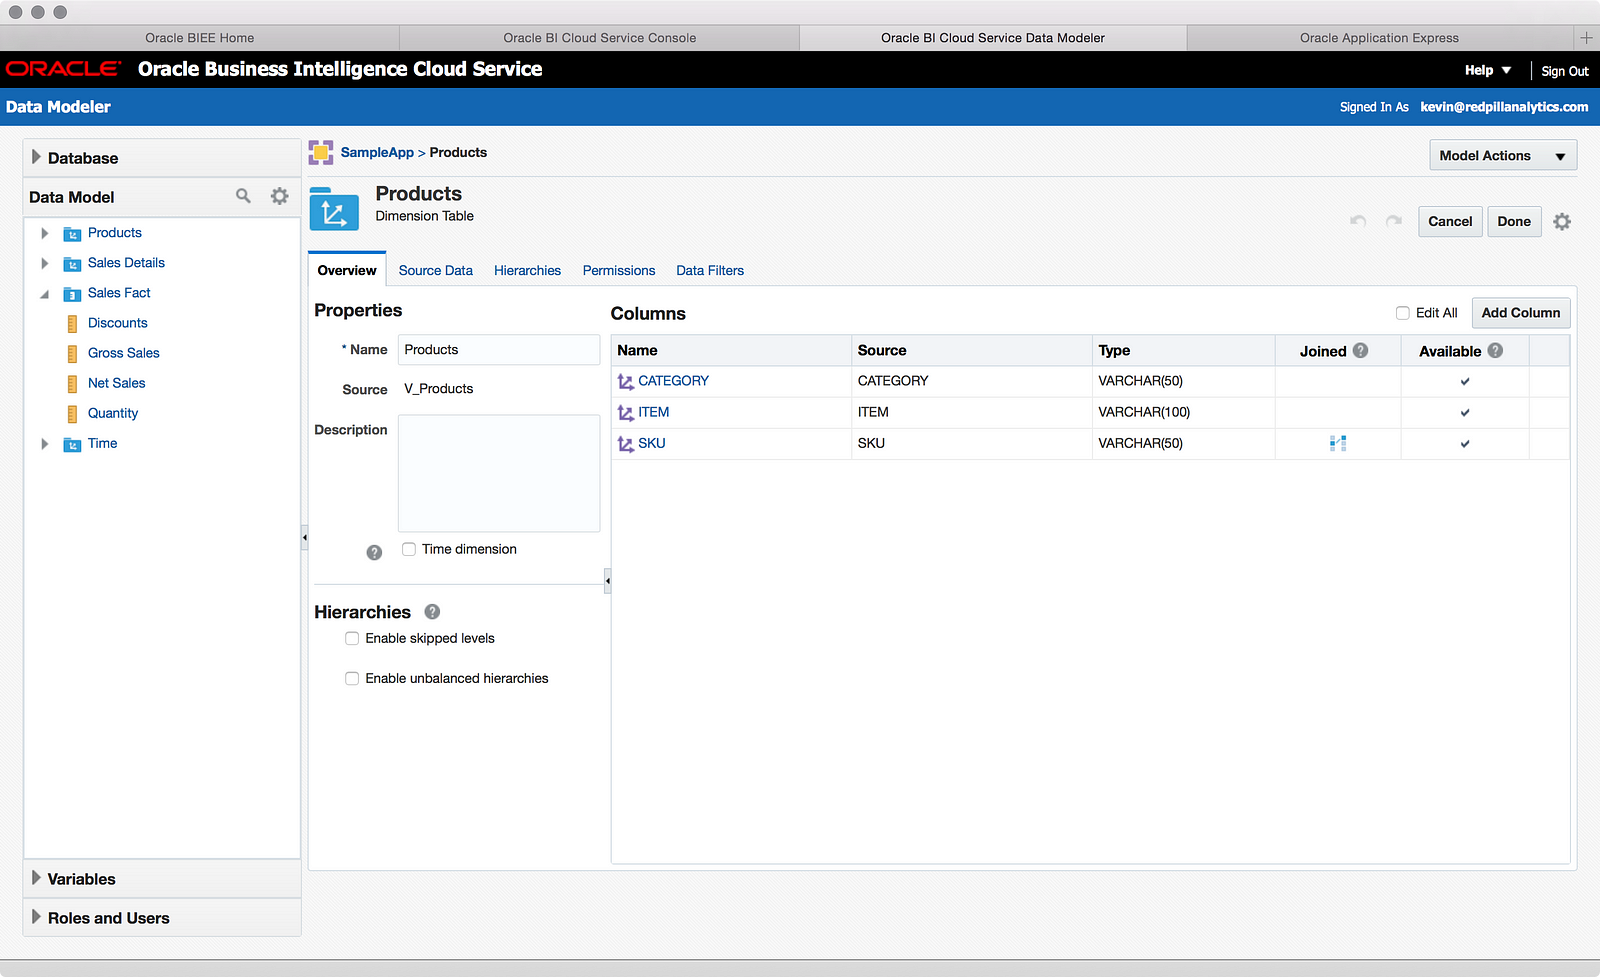
As you can see, many of the same things are in the dimension table properties as in the fact table, with some obvious differences: hierarchies and time dimension definition. As you can see in the screenshot, there is even support for skip levels and unbalanced hierarchies. I don’t have any need for these complex hierarchies yet, but let’s look at how to create a standard balanced hierarchy:
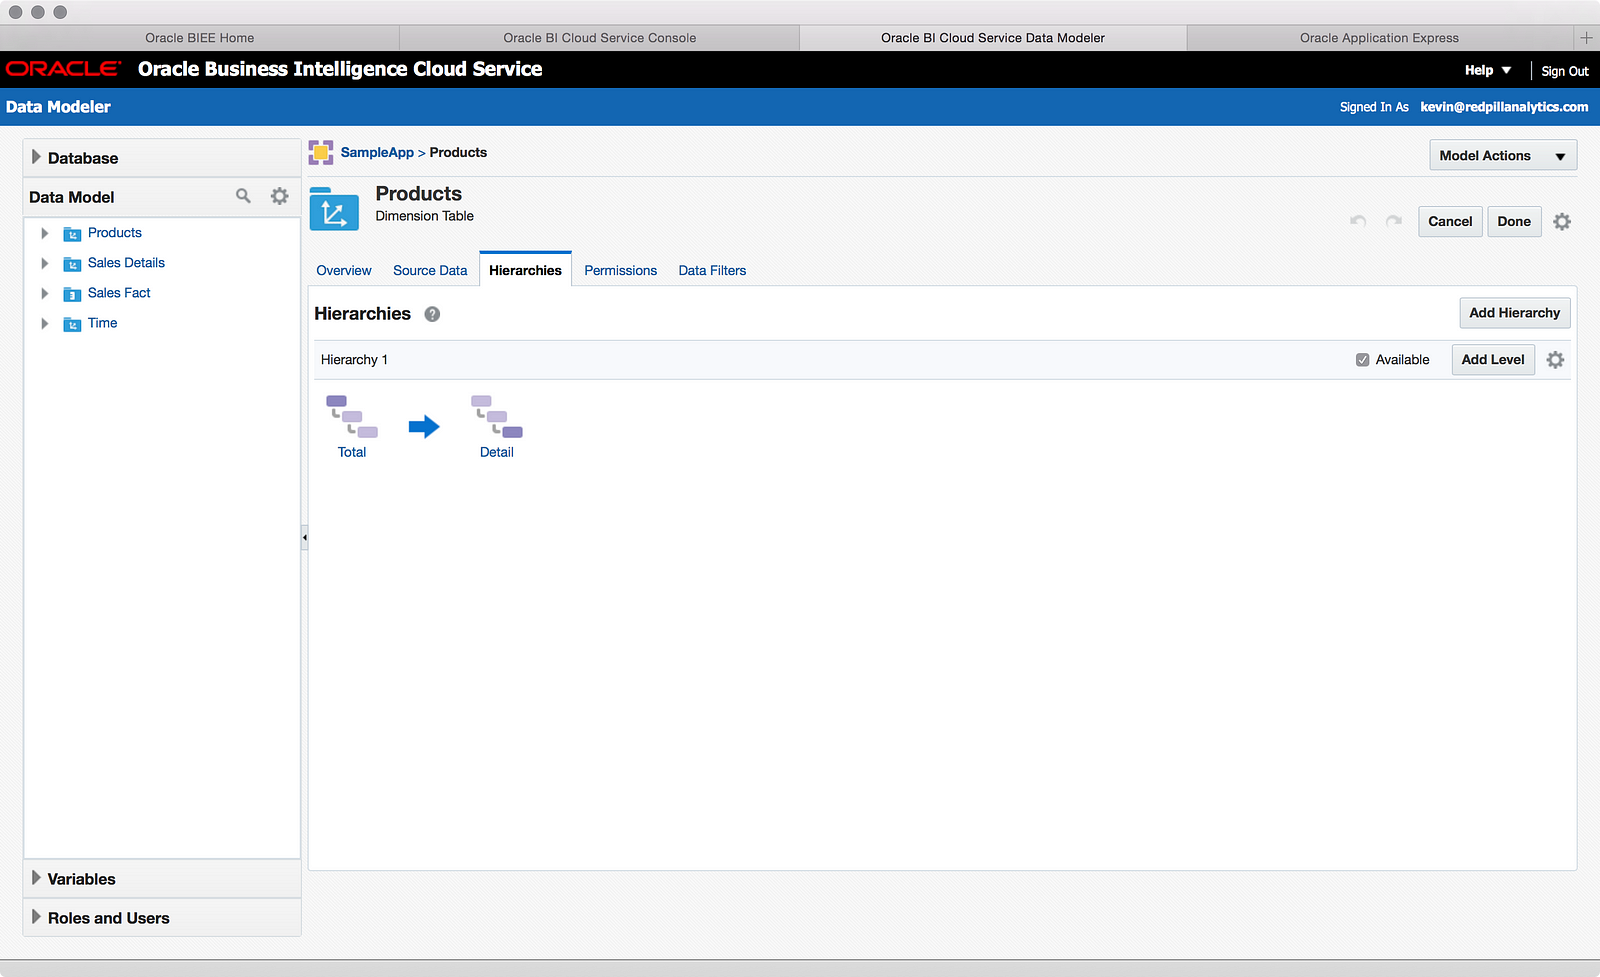
Out of the gate, the Data Modeler defines the “Total” and “Detail” level for you, and from there you can add levels, rename levels, rename hierarchies, and even add new hierarchies, though they must all use the same total and detail levels. It should also be noted that creating these hierarchies not only creates drill paths, but also hierarchical columns. Creating multiple hierarchies creates multiple hierarchical columns, which will get to in a bit.
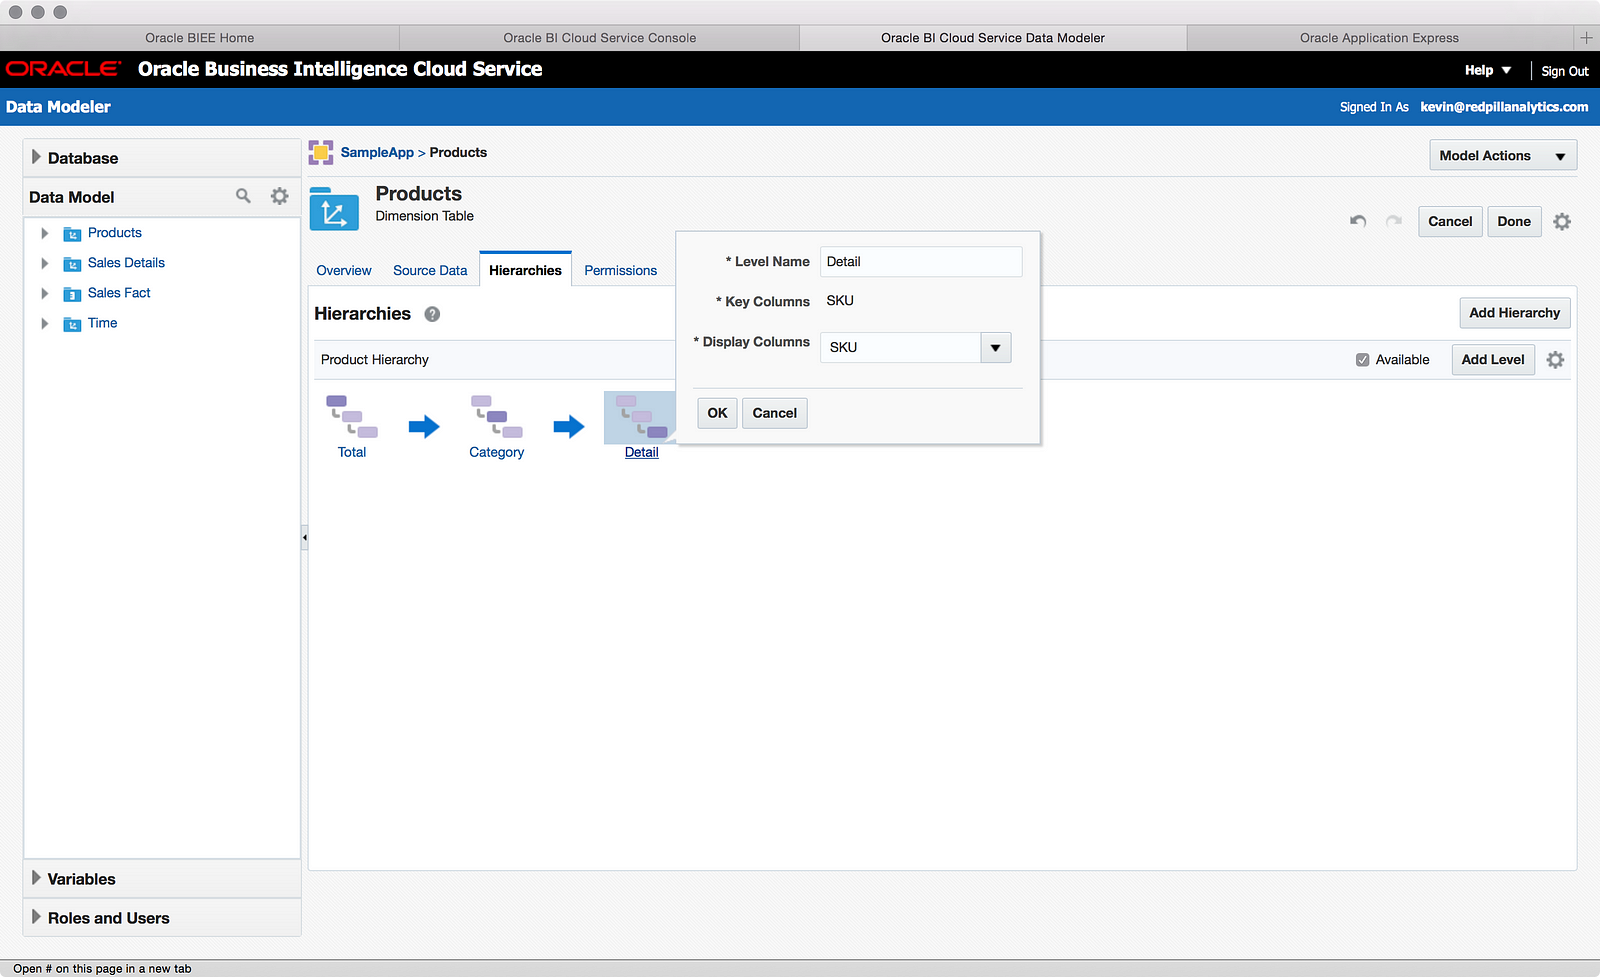
As you can see above I started creating a Product hierarchy that allows a user to drill down through the Product categories to the Product SKUs. As I mentioned above, I’m not sure that SKU is the right column for the detail level. This is something I should have probably investigated before doing anything, but in my excitement I did not, so was that a wise choice?
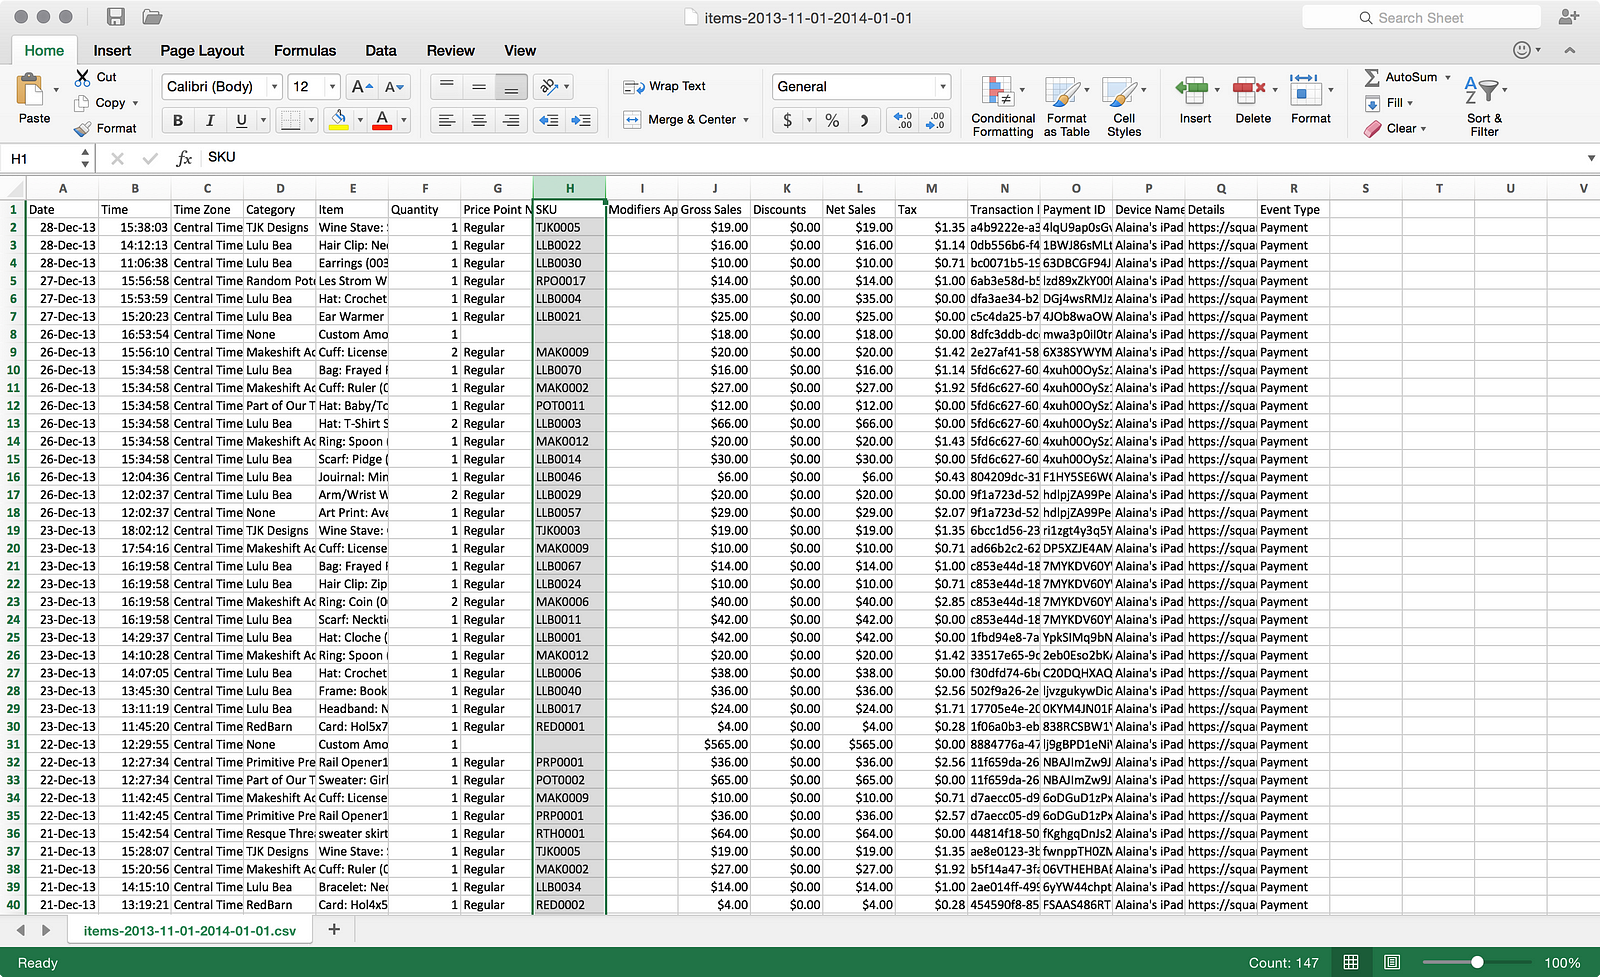
Crud. As you can see from one of my source files, not every row has a SKU. Thinking about my wife’s business and Square’s functionality, it’s possible for her to charge any random amount of money not associated to a specific product. That means I’ll have to use the Item name as my key.
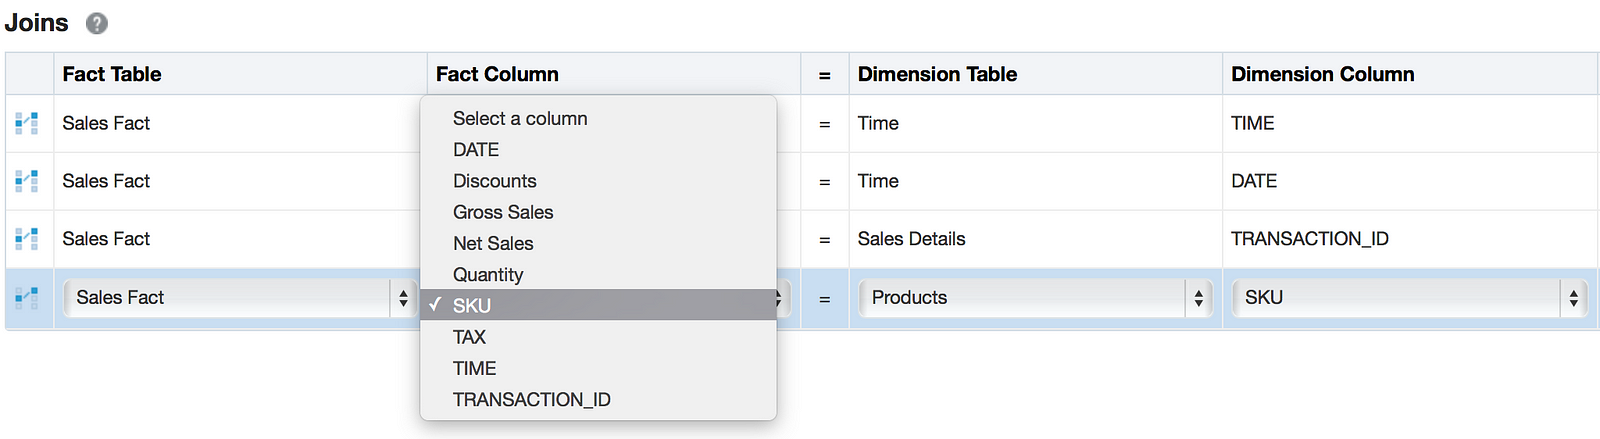
Remember when I defined my keys in the wizard and it auto-created the joins for me? Well, since I didn’t define “Item” as a key column, it didn’t add the column to the Fact table, so now I can’t define it as part of the join. No problem; I’ll just drag the column into the Fact table. Wrong! You can’t access database table/view columns from the database browser on the left. Maybe I’ll define a new calculated column in the table. Wrong! You can only map calculated columns to already defined logical columns, not physical database columns. Grrr. Sensing I might need to start over, I decided to see where I else I might have erred, so I started to look at my Time dimension and noticed a little help guide next to the checkbox that identifies a dimension as Time dimension:
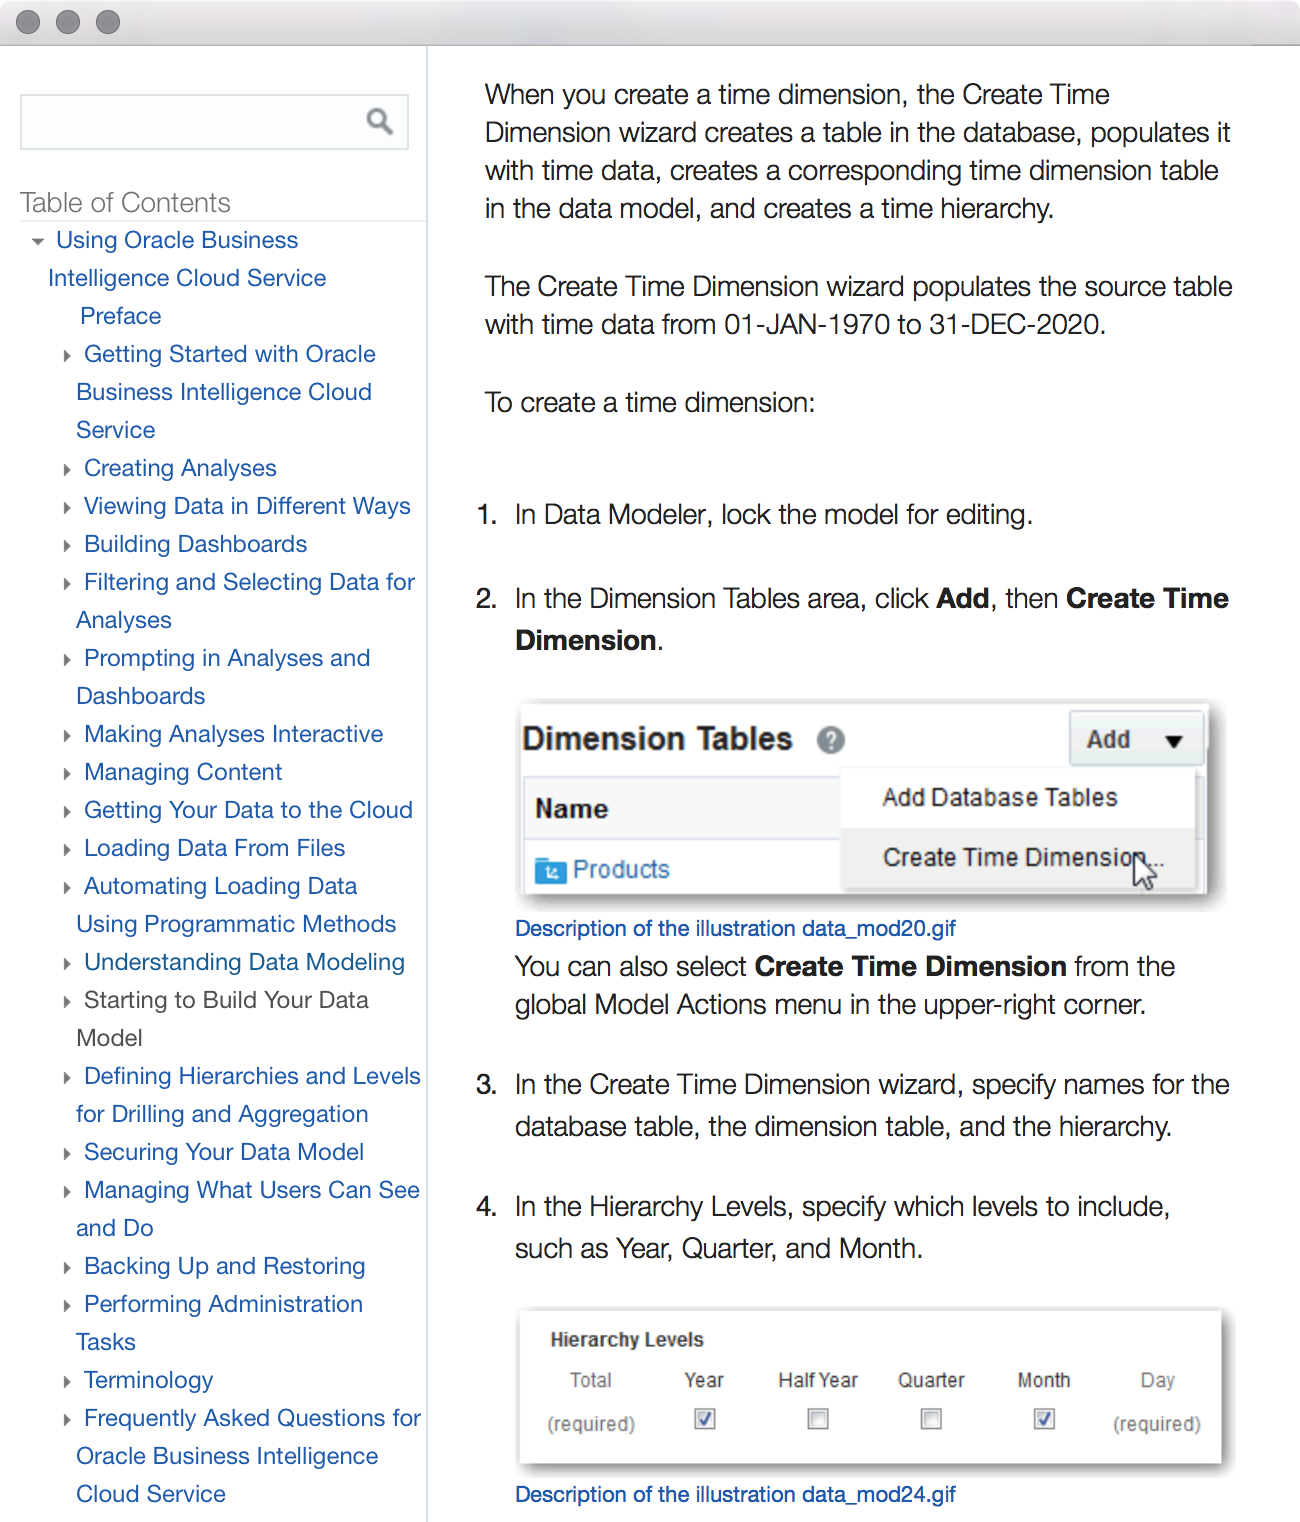
Hmmm. First, it’s kinda cool that BICS can create a time dimension for you. Second, and more importantly, the time dimension can only be created at the day level. Since we’re talking about retail POS data, hourly analysis is desirable as well. Therefore, I was going to have to perhaps create my own time dimension. Could I use the one I already defined? Well, if you recall from Part 01, my time column is actually a VARCHAR, not an actual time field. That might be a problem. My transactional data also only contains the date and time values that actually had sales, not all the possible dates and times in a given period. This might prove problematic if I decide to add a new data source or if I want to somehow do an outer join to see dates/times where there are no sales. Should I start over? At the risk of losing you as a reader because you read all this way without seeing a finished model, I think I will start over.
What have I learned from this so far? Well, I could plow on and finish creating a quick and dirty model from what I had. Agile development principles encourage this. I wouldn’t have been able to do everything I wanted, but some basic things would’ve worked and that’s a good thing. While I’m eager to see some of this data in the front-end, this is all about the journey, not the destination, so I’m not going to cut to the finish line just yet. It also proves to me that you do need to put some thought into what you want to do. Not because there are limitations within BICS, per se, but because in the world of manipulating and analyzing data, it’s possible to progress down a path and realize, “crap, I really need to do something different instead.” So…stay tuned for Part 04 where I continue my modeling journey.