
By Deiby Gómez
Snowflake is a top choice for data warehousing and cloud analytics, thanks to its exceptional scalability and performance. However, like any complex system, it isn’t immune to challenges. Performance issues, such as slow queries or overloaded warehouses, can disrupt data operations. The key to maintaining optimal performance is addressing these issues quickly.
This guide serves as a go-to resource for improving the overall efficiency of Snowflake environments. We’ll break down the key factors affecting performance—such as query execution times, resource use, and system efficiency.
Our goal is simple: to help consultants pinpoint bottlenecks and implement targeted solutions. From troubleshooting specific queries to optimizing entire systems, the methods discussed here will enable you to deliver solutions that directly improve operational outcomes. One tool that I recommend is Prismafy. It delivers quick, actionable insights in just 1.5 minutes—at no cost—giving consultants the data they need to make informed decisions and provide immediate fixes. This guide will walk you through the process of tuning SQL statements using Prismafy’s approach, step by step.
I highly recommend using Prismafy because it generates insights that we can use to quickly asses to find solutions (and it’s free!).
What is Prismafy?
It’s an open-source tool developed in Python that I developed to analyze metadata for cloud-native data platforms. It provides charts and insights enabling you to easily detect and fix problems faster. This guide will walk you through the steps to tune a SQL Statement using Prismafy.
Here is the documentation to help understand Prismafy and Snowflake query performance optimization.
How to Use Prismafy to Analyze a Specific Query
Follow these three simple steps:
- Download Prismafy: https://github.com/prismafy/prismafy
- Run Prismafy for the specific query:
python prismafy.py -d snowflake -t password -a abc.us-east-2.aws -w Prismafy_wh -u Prismafy_user -m 6 -r Prismafy_role –qa your_query_parameterized_hash
Note: You have to provide the value of “query_parameterized_hash” not the “query_id”.
- Open the “prismafy-reports/prismafy-<date>/prismafy_index.html” report
From the index page you can access the following reports:
- Bytes Details
- Calls details
- Time details
- Rows details
- Warehouse changes for the query
- Accessed Objects by the Query
- Pruning Efficiency for each Table touched by the Query
- Last Executions Details
- Check details for each Query Profile used by the Query
- Detect changes in your Query Profile
Now, let’s look at each report.
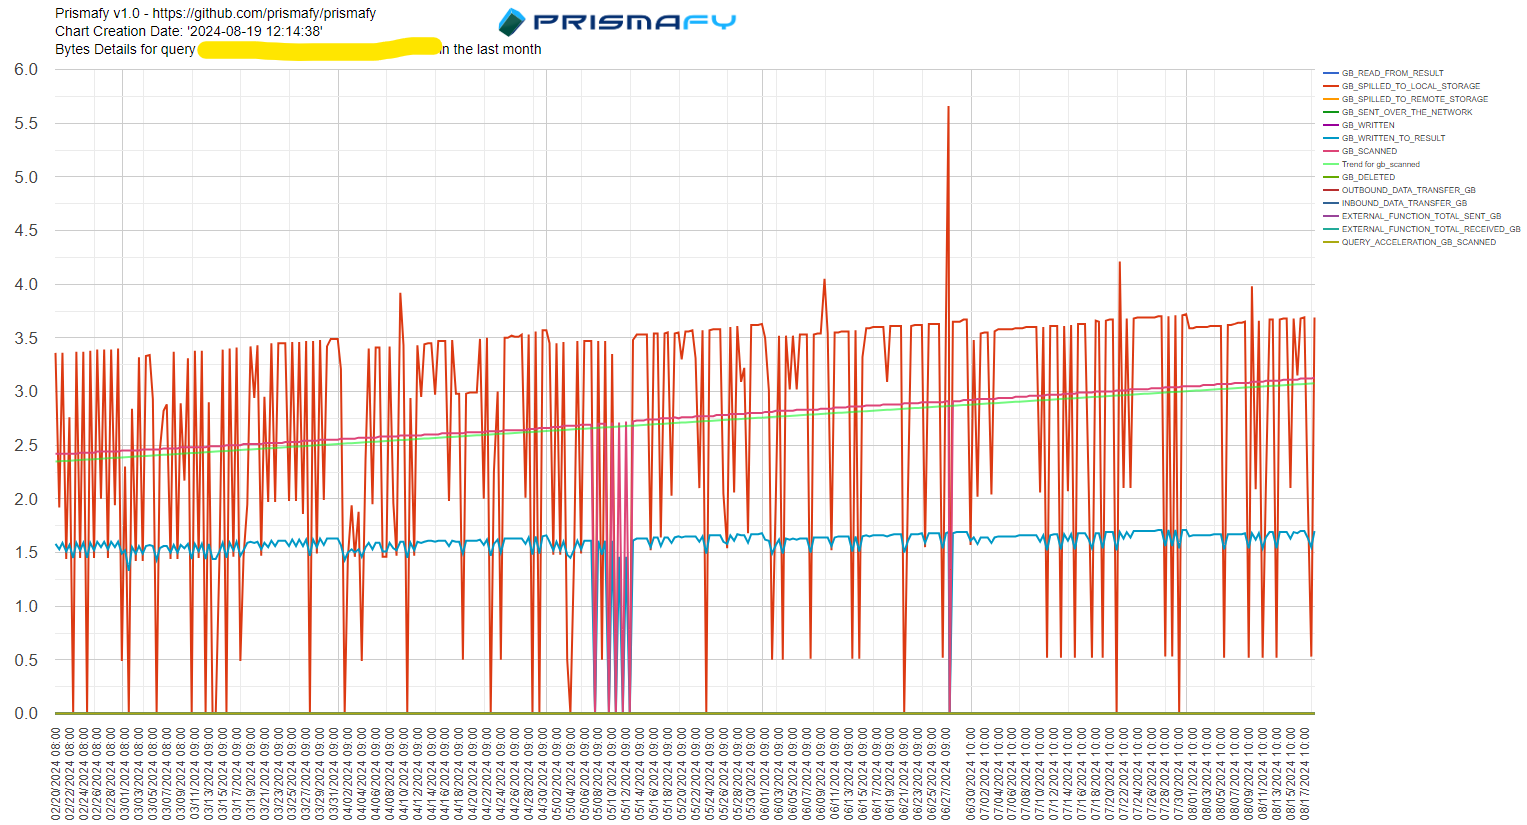
Bytes Details Report:
You can start analyzing this report to detect if your query is spilling GBs to local or remote storage. This event is one of the most common causes of bad performance in Snowflake. This report includes the following information:
- gb_read_from_result
- gb_spilled_to_local_storage
- gb_spilled_to_remote_storage
- gb_sent_over_the_network
- gb_written
- gb_written_to_result
- gb_scanned
- gb_deleted
- outbound_data_transfer_gb
- inbound_data_transfer_gb
- external_function_total_sent_gb
- external_function_total_received_gb
- query_acceleration_gb_scanned
For example, in the following chart you will see if the report shows that the GBs spilled to local storage (red line) exceed the GBs scanned by the query, it indicates that the warehouse doesn’t have enough memory to process the logic of this query.
Calls Details Report:
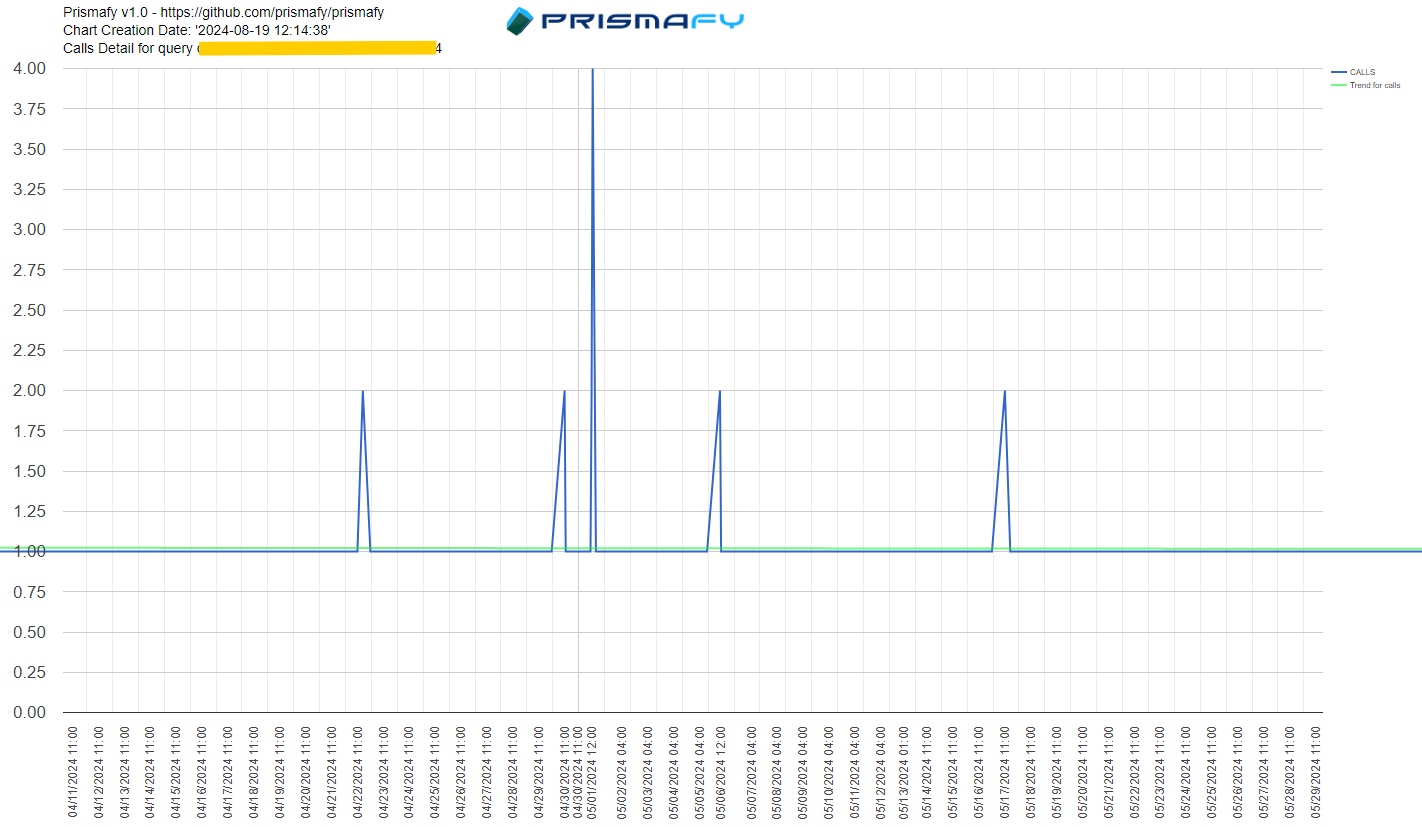
This report provides information about how frequently your query is being called. If you your query is taking a lot of time and you have ruled out issues in the Bytes Details Report, then you want to proceed to analyze this report, perhaps the root cause of the problem is that your query is being called too many times or you can also discard that scenario like in the following image. We can confirm that this query runs just few times a month.
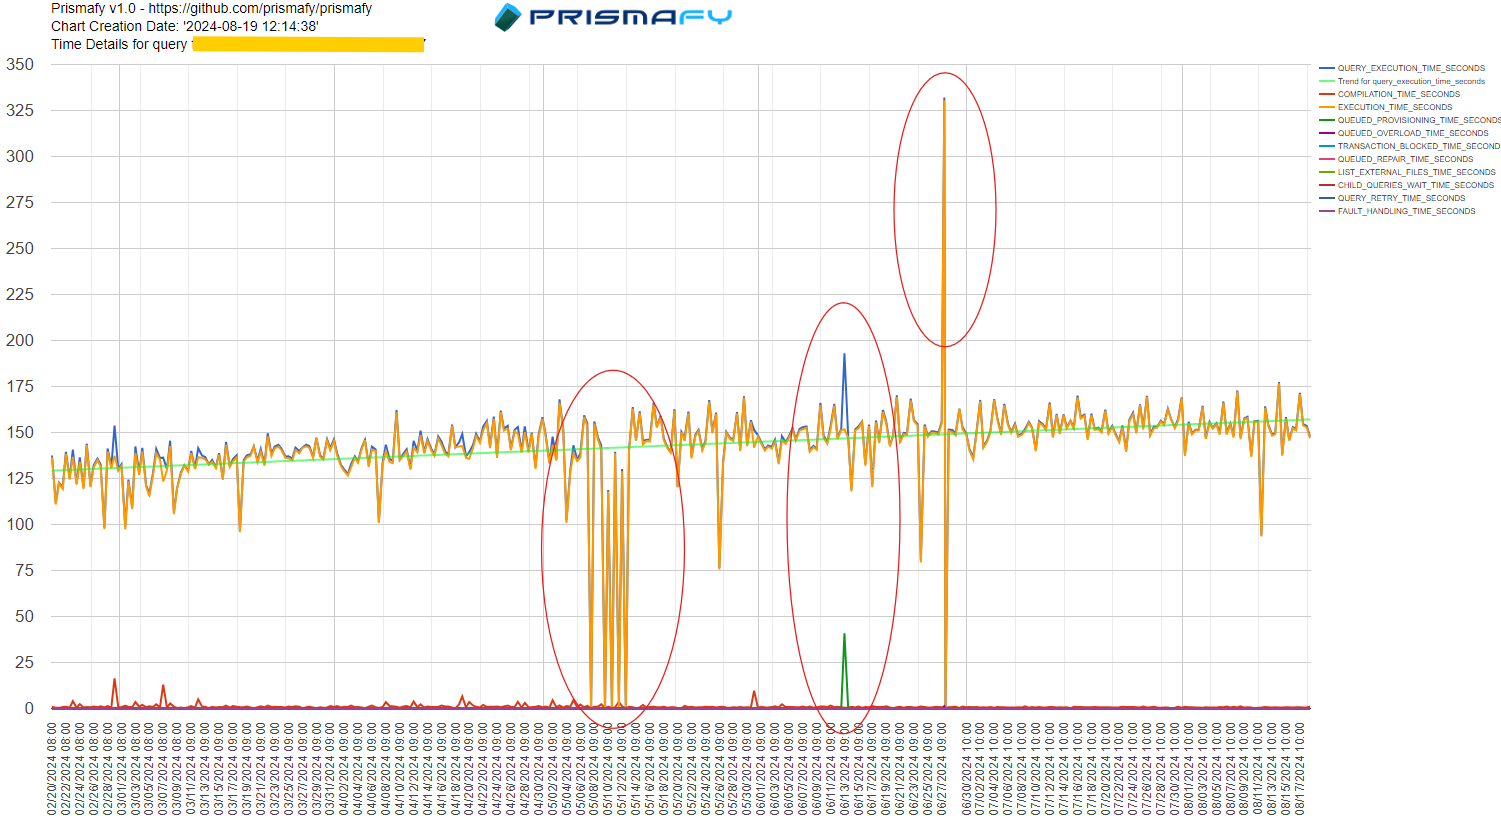
Time Details Report:
This report provides information about which event your query is spending more time and has information about the following events:
- query_execution_time_seconds
- compilation_time_seconds
- execution_time_seconds
- queued_provisioning_time_seconds
- queued_overload_time_seconds
- transaction_blocked_time_seconds
- queued_repair_time_seconds
- list_external_files_time_seconds
- child_queries_wait_time_seconds
- query_retry_time_seconds
- fault_handling_time_seconds
For example, in the following image, you can analyze on which dates the query was taking the minimum and maximum times, also if an event is impacting the overall time. For instance, in this chart, the queue provisioning time had an impact on a specific day on the overall time. One of my favorite things in this chart is the green line, which is the trend of your elapsed time. You can easily identify if the query is stable in terms of elapsed time or if it’s growing, which helps you plan your credits spending effectively.
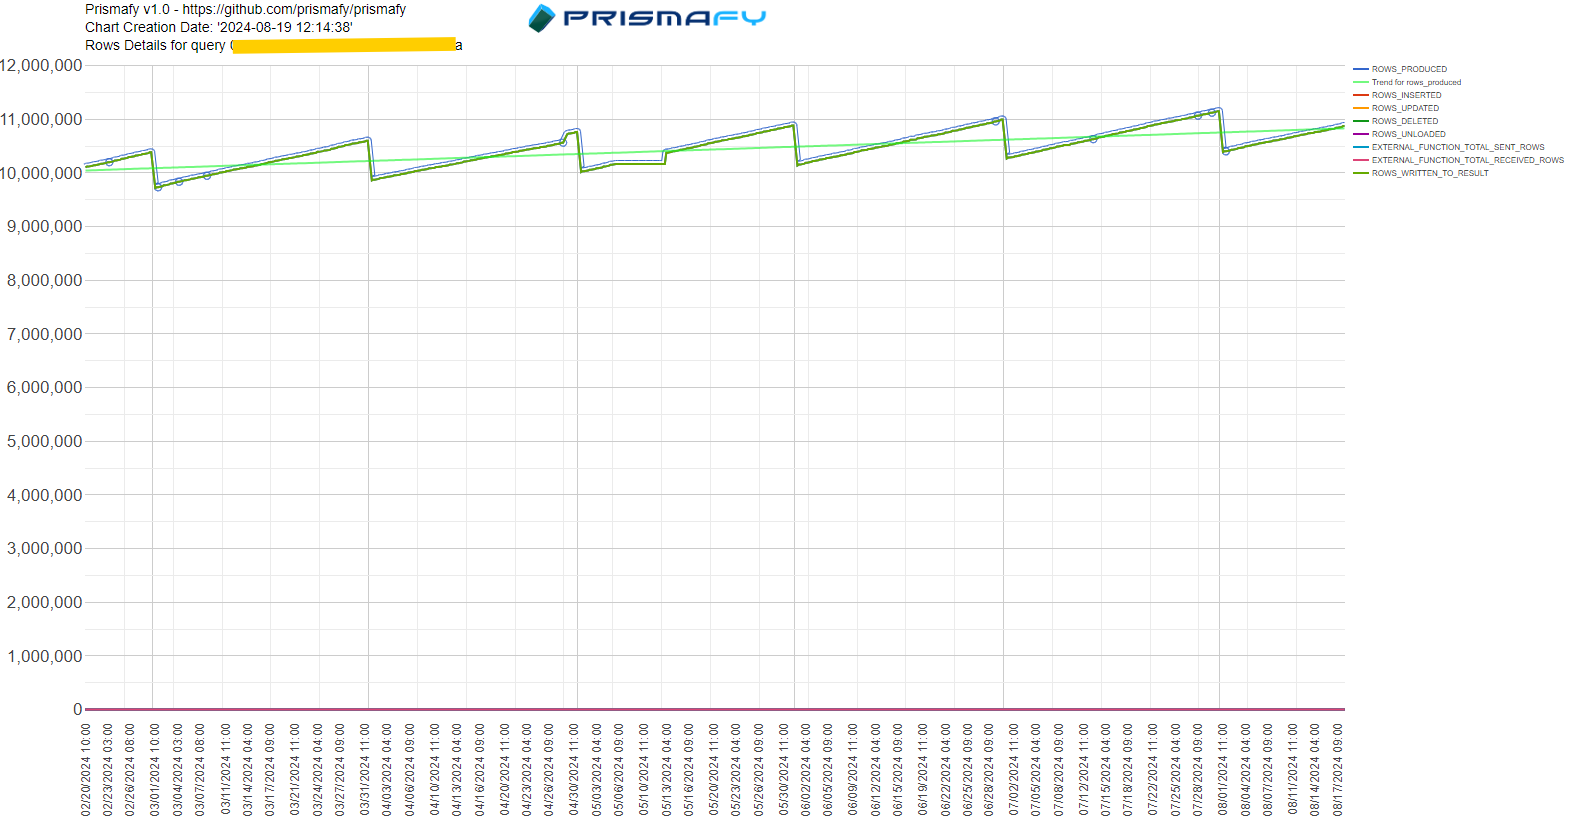
Row Details Report:
This report provides information about events where your query is generating rows. This is useful because it allows you to understand the behavior of your query and tune it properly. It includes information about the following events:
- rows_produced
- trend for rows_produced
- rows_inserted
- rows_updated
- rows_deleted
- rows_unloaded
- external_function_total_sent_rows
- external_function_total_received_rows
- rows_written_to_result
For example, you can see that the query has a monthly behavior; it starts generating an amount of rows that grows over the days in the month until reaching the maximum amount of rows. This is important to understand when your query processes more data and delivers more data.
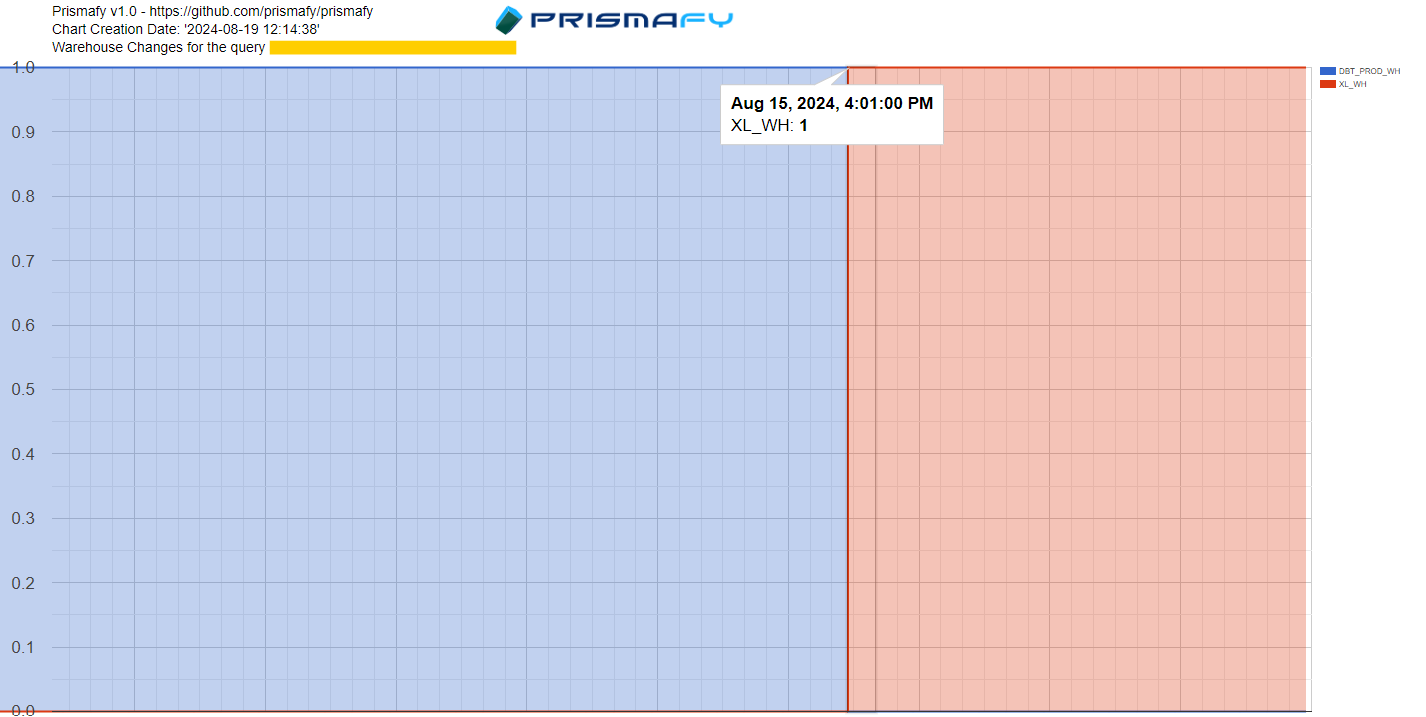
Warehouse Changes Report:
This report is useful because it will let you know if the warehouse used to process the query has changed over time. Personally, I had a scenario where only the elapsed time was used to measure a query. One day, the query’s elapsed time changed from 20 minutes to 5 minutes approximately, and the customer was happy. However, when I checked if the warehouse changed, I saw a change from a Small Warehouse to a 2XL warehouse. That explains the reduction in the elapsed time, but perhaps the spent credits would be the same… or even more. In the following image, the warehouse was changed for the analyzed query on August 15.
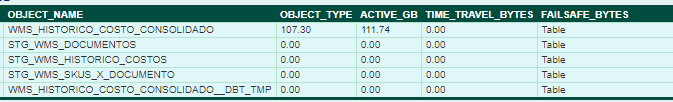
Accessed Objects Report:
If after analyzing all the previous reports (Bytes Details, Row Details, Time Details, Call Details) you still don’t find the root cause of your SQL poor performance, it’s time to start analyzing every single step that Snowflake follows to process your query (Query profile, or Execution Plan as I like to call it). But before that, get familiar with the objects that your query is accessing and, most importantly, the size of those objects. It’s not the same for a query accessing a 50 MB Table than 250GBs table.
For example, in the following table, most of the tables are very small (rounded to 0 GBs), while only one table has 112 GBs. So a bad join or operation on this big table would impact considerable the performance for the query.
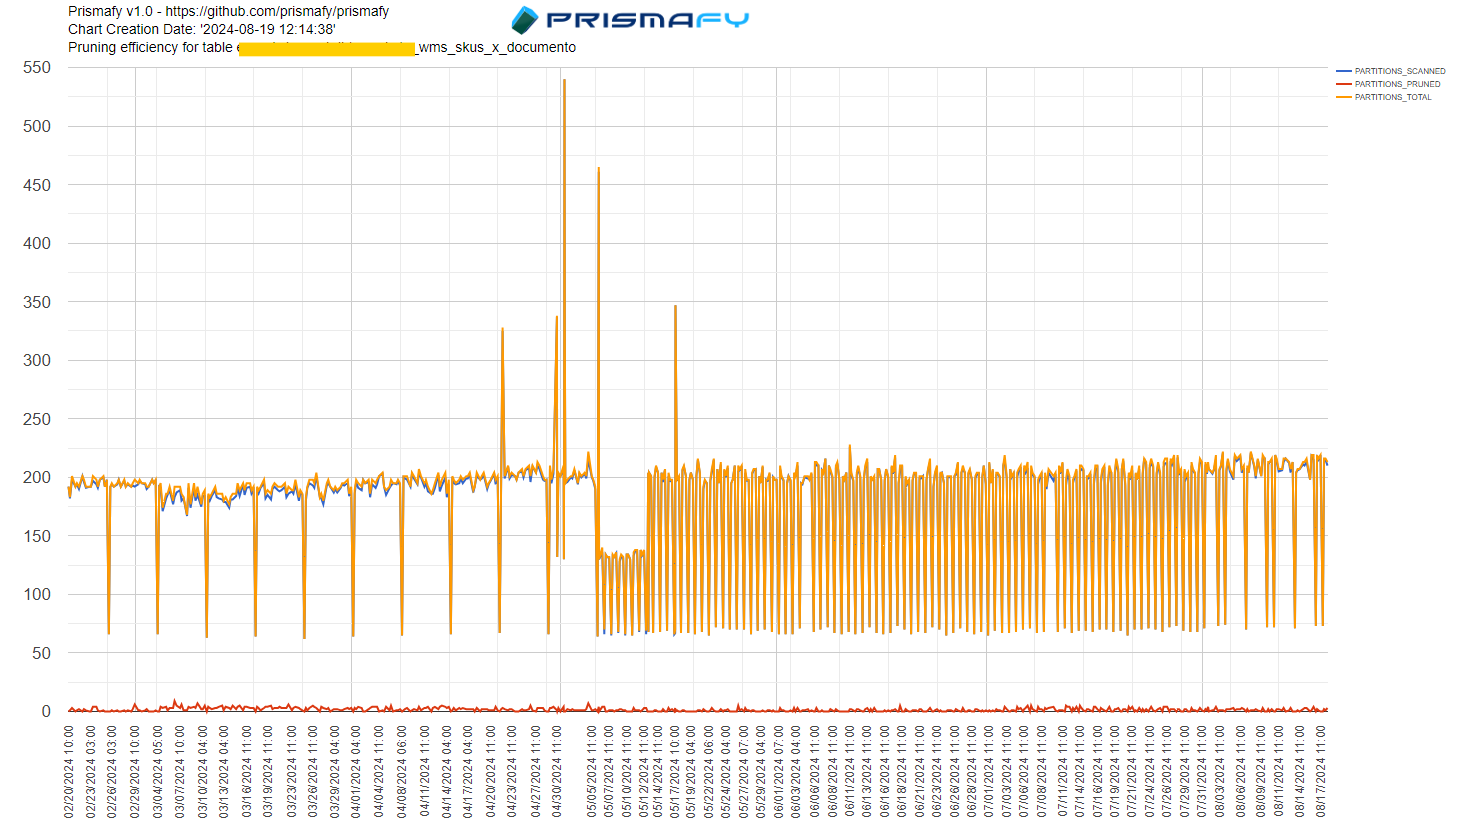
Pruning Efficiency for each Table touched by the Query:
After discovering which tables are being accessed by the problematic query and the table size, the next step that I suggest analyzing is the pruning efficiency for those tables. The ideal scenario is where Snowflake is able to prune most of the partitions; that will provide the best performance for your query.
For example, in the following chart, the red line (partitions pruned) is too low in comparison to the yellow line (partition total), which means that the table is having a bad pruning efficiency, and that would contribute to the query bad performance. There will be a chart for each table accessed by the query, so you can analyze each one separately.
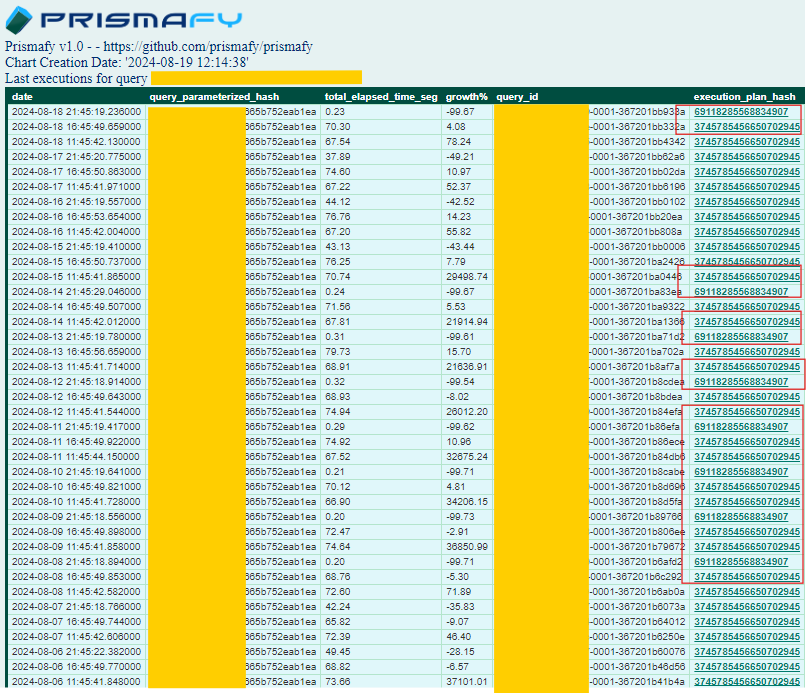
Last Executions Details:
Finally, in this report you will find all the details for the last executions of the query. But my favorite parts are the following:
- Growth%: I really like this column because I can see how much an execution has growth in comparison to the previous execution. I can detect here specifically problematic executions of the query.
- When a Query Profile (I like to call it “Execution Plan”) has changed? It’s easy to see at the column “Execution_plan_hash”, if the number changes it’s because Snowflake changed the way it is executing your query.
- When Snowflake changed the Query Profile: At the column “Date” you can see exactly when Snowflake changed the way it is executing your query.
If you click on an specific “execution_plan_id” you will see all the details for that Query Profile, step by step, and on which object the step is performed.
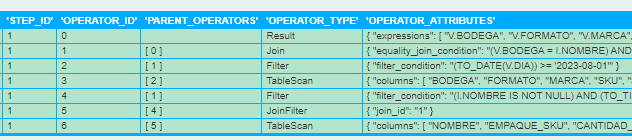
Additionally, you will see stats for each step of the query profile:
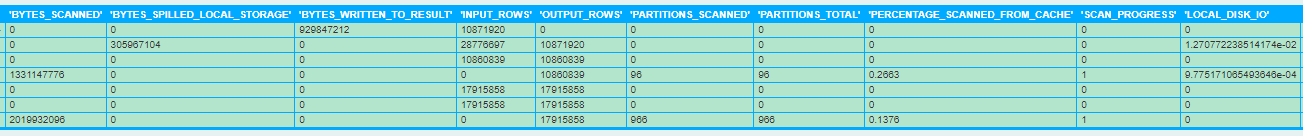
With all this information you will be able to see which step is problematic in the Query Profile and perform the proper adjustments to your query.
Looking Ahead: Optimizing Snowflake for Peak Performance
Successfully managing performance in Snowflake requires a solid grasp of system metrics, along with the ability to analyze and interpret performance data. In this article, we’ve covered various methods for visualizing performance metrics through charts and tables, offering a clearer picture of query execution, resource usage, and system load.
With Prismafy, Snowflake consultants gain a powerful tool to spot issues such as slow queries and overloaded warehouses. By using these insights, you can find the root cause of the problem and make smart tweaks to boost your system’s performance.
Stay tuned, as I’m working on a series of Snowflake-related blogs. Next up:
How to detect when the Query Profile changes for a query in Snowflake
Deiby Gómez was the first Oracle ACE Director of Guatemala (2015-2023), he has 35 Technology certifications among them the highest certifications for Oracle Database (Oracle Certified Master, OCM) and 3 Advanced Snowflake Certifications (Architect, Administrator and Data Engineer). Deiby is an engineer with 2 master’s degrees and a future lawyer. Deiby has been a speaker in Technology Events in more than 12 countries including Oracle Open World in San Francisco, USA. He is the Technical Reviewer of the book “Oracle Database 12cR2 Multitenant – Oracle Press” and he is co-author of the book “Oracle Database 12cR2 Testing Tools and Techniques for Performance and Scalability – Oracle Press”.
For more Snowflake insights, check out our Snowflake-related blogs or visit the Snowflake Developer Resources.