I know it sounds like I am writing about 1980s technology, and I am, but the fact remains that Excel is still a widely used tool in the business world. Besides, what else would you put your data dumps into?
Often Excel reports get used for management reporting, which comes with a number of issues. These reports can make for some large Excel files that get emailed out and clog up inboxes, or sit out on a shared drive somewhere. Plus someone has to put these reports together each day, which can be time consuming, is often repetitive and requires time spent cross training others to do these, unless that person never takes time off, gets sick, quits, or retires. Maybe managment wants to pull their own report, what if they select the “wrong” criteria? This can lead to multiple versions of the truth. I know you are thinking “there has to be another way!” Yes… there is.
The other way is through self-service Business Intelligence (BI). BI no longer has to be for large companies with lots of money to spend on IT. Smaller organizations, or even teams within larger organizations can now realize the benefits and power of BI, without all of the cost that is associated with traditional on-premises BI solutions. There are a multitude of cloud products available with different pricing models and approaches to BI that could fit an organization’s needs. If you want to know my thoughts on various cloud BI products, their strengths and weaknesses, stay tuned for future posts! However, if you want to know how to prepare your Excel data for use in these tools, or even just for use in Excel reporting, click the link at the end of this article. For now though, I am just going to focus on what BI (whichever tool you use) can provide that Excel reports don’t, or can’t offer.
Before I bash on Excel any further, let me say first that I love Excel. I use it all the time for my personal life and I still use it professionally today. Excel is an extremely useful and powerful tool for rapid analysis and keeping track of relatively small amounts of data. However, Excel is not very good at aggregating data to different levels. Sure, it can be done; it just takes work. It’s also not very intuitive for doing deep dives into the data from graphs or pivot tables. Nor is it that useful for reporting beyond a limited set of users that you would like to see the same information.
One of the very powerful features of BI is security. Security can give you the ability to create a report for a large audience, but restrict what is seen in that report by the user groups you define, which allows you to reach a large audience, but only have to create one report to do so. On a larger scale, security allows everyone in your organization that you want to give access to to use the BI tool but only access certain reports, or certain sets of data that all sit in the database; no more having to manage the many reports stored on shared drives, deveolpers’ computers, etc.
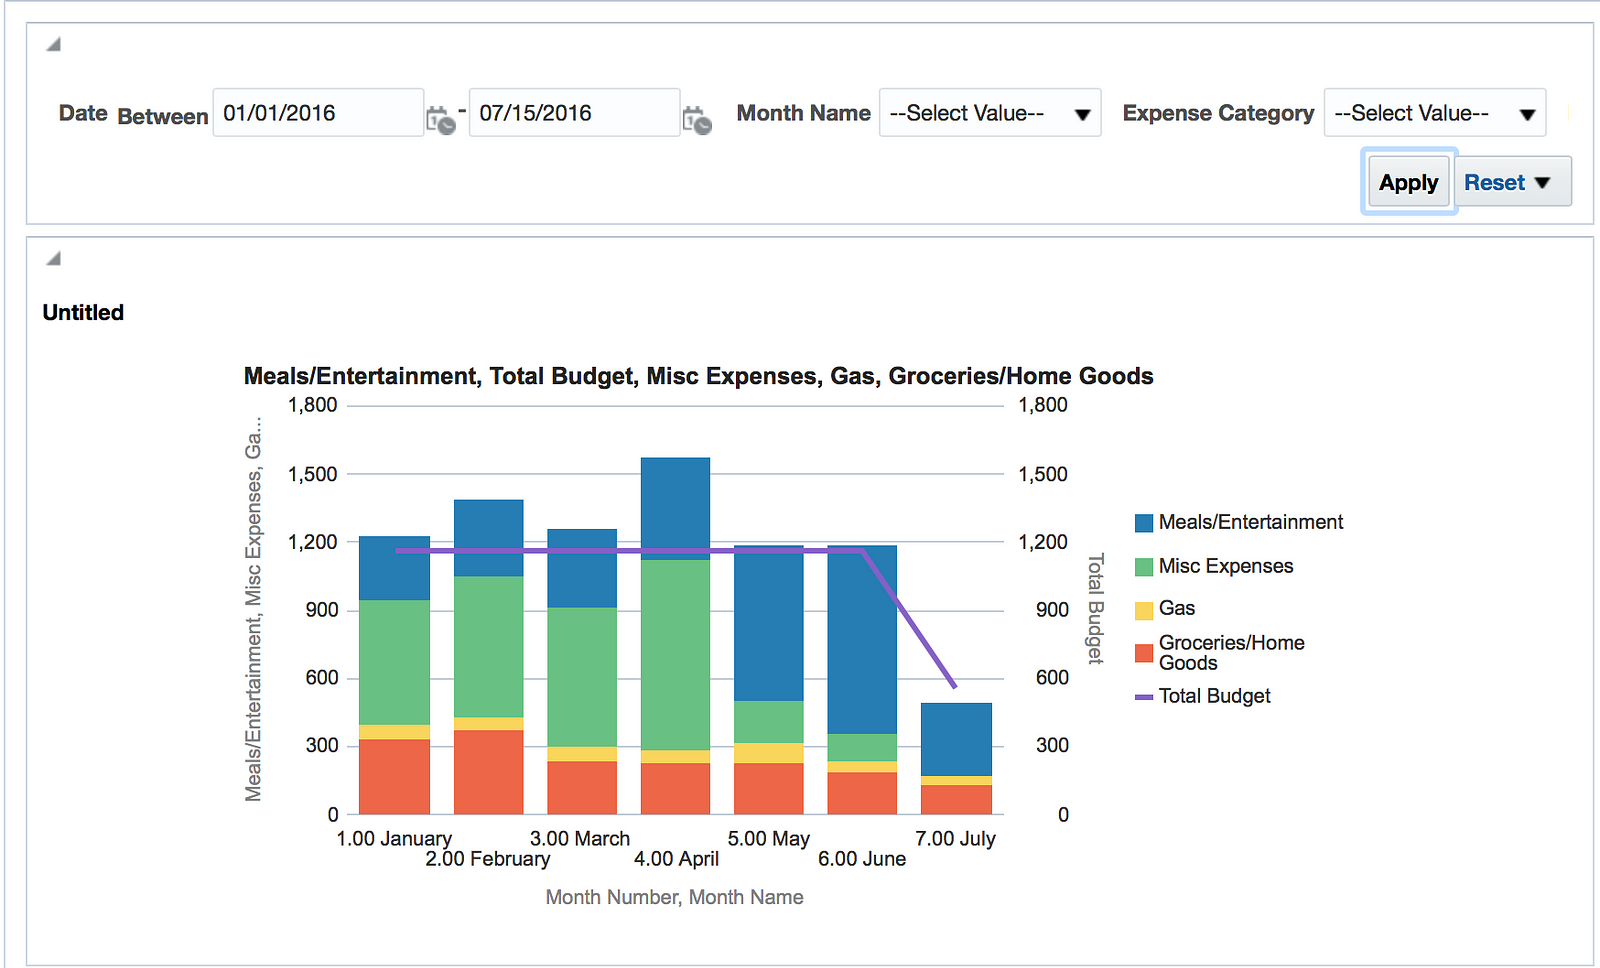
In the case of management reports, or others that are recreated at rapid intervals such as daily, BI dashboards are an excellent replacement for Excel. These interactive dashboards allow you to set the prompts to default values, but also allow the user to select their own range of criteria. By structuring dashboards this way, you can reduce or eliminate the multiple versions of the truth problem. From this high level — in this case expenses by month — users can easily drill down to whatever level of detail they want, either by clicking on the visualization, or by selecting different dashboard prompts:

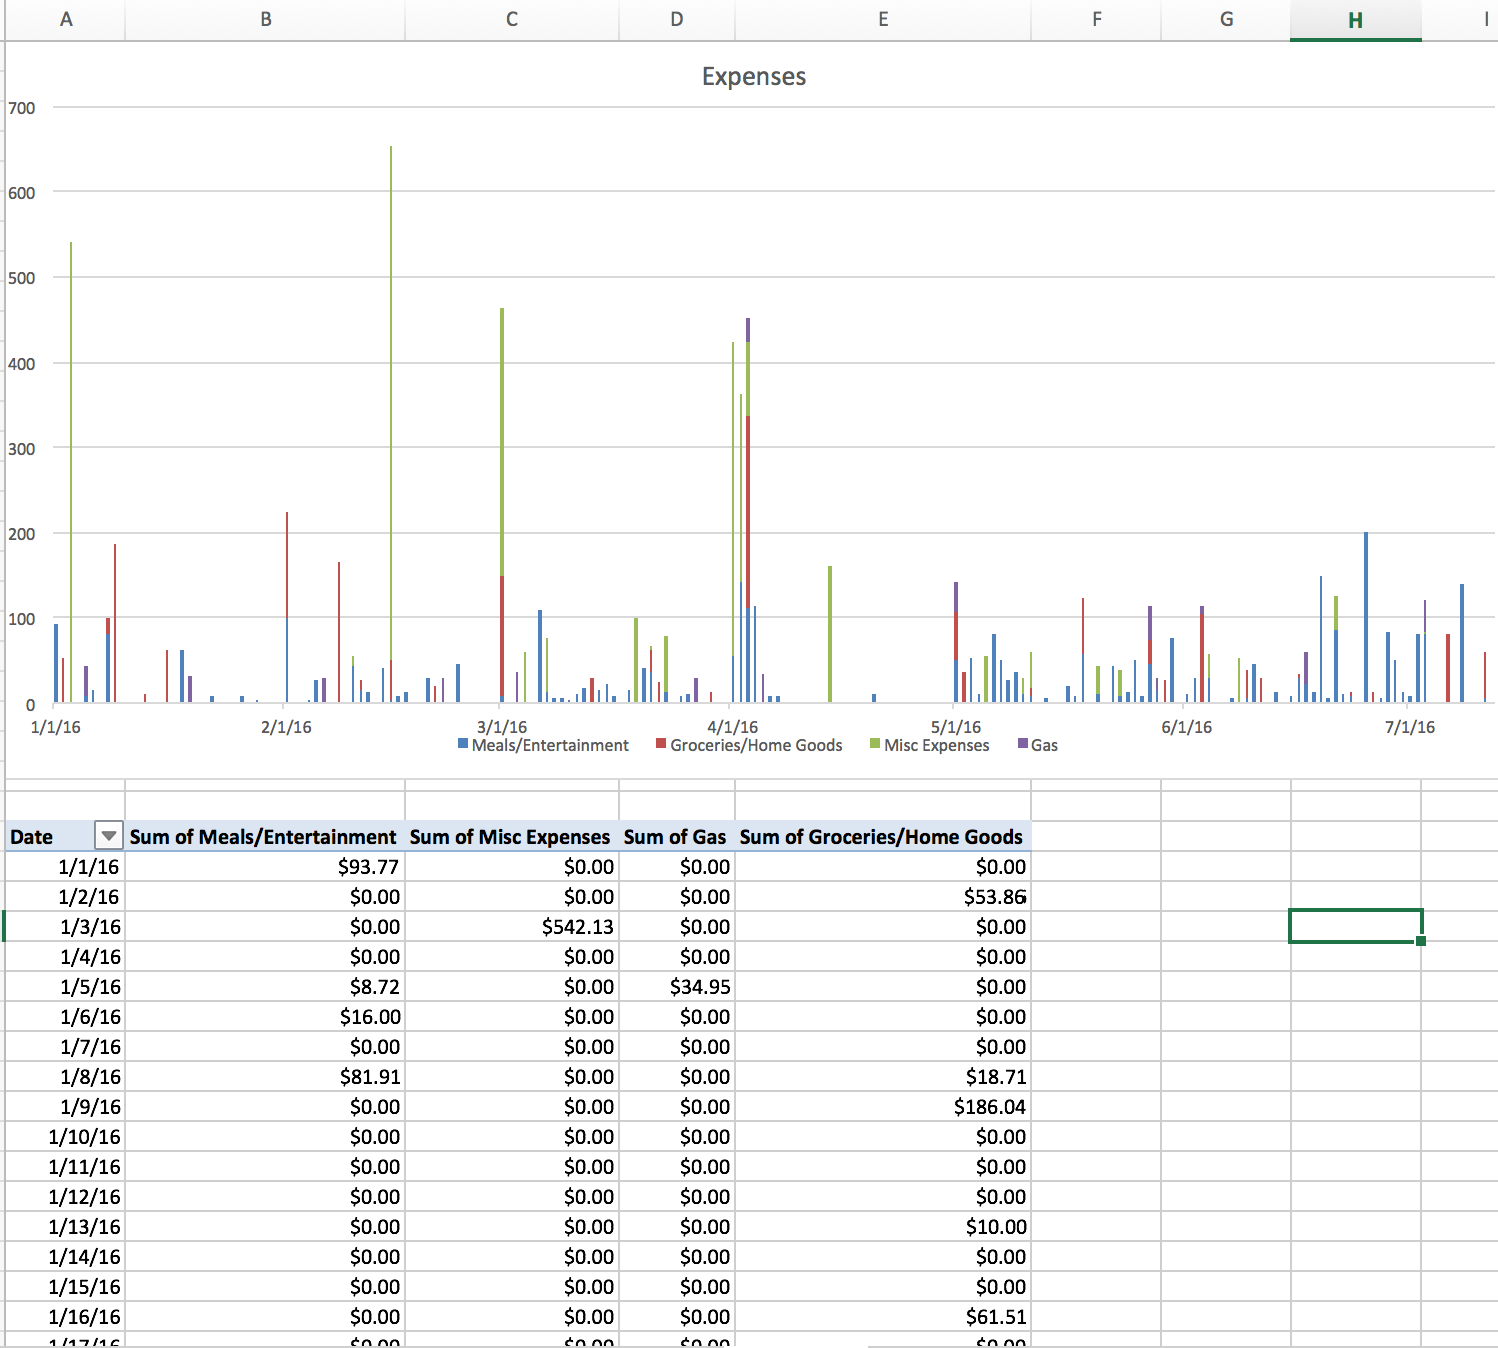
Or you could just have a basic page like this in Excel…

There are a lot of other benefits to BI as well, but I’m purposefully being brief because I want you conscious. If you are still awake and want to know how to prepare Excel spreadsheets for analysis, click here. Stay tuned for future posts about my reviews of some of the cloud BI tools out there, like Domo, Tableau, Oracle BICS and more!