
I’ll address the title of this right at the top, in short, it depends. The long answer, which I will discuss as I go through this article, is it depends on how you intend to use it. If you are a small company or team with fairly simple data needs, and you are using it as a replacement for Excel reports, then it is a pretty good tool for this. However, It is not a great option as an enterprise level solution. Okay, so you are a small team or company and you need a visualization and reporting tool for your data and you are asking “What is Domo is like to use?” Good Question, here we go.
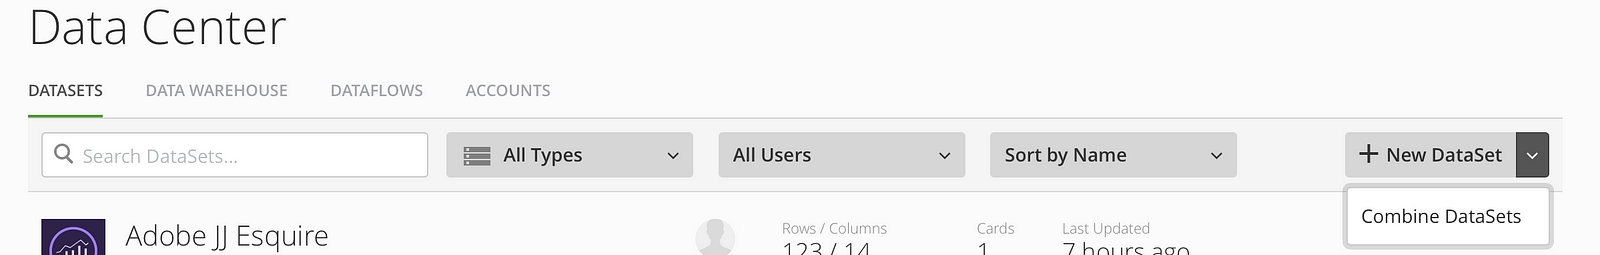
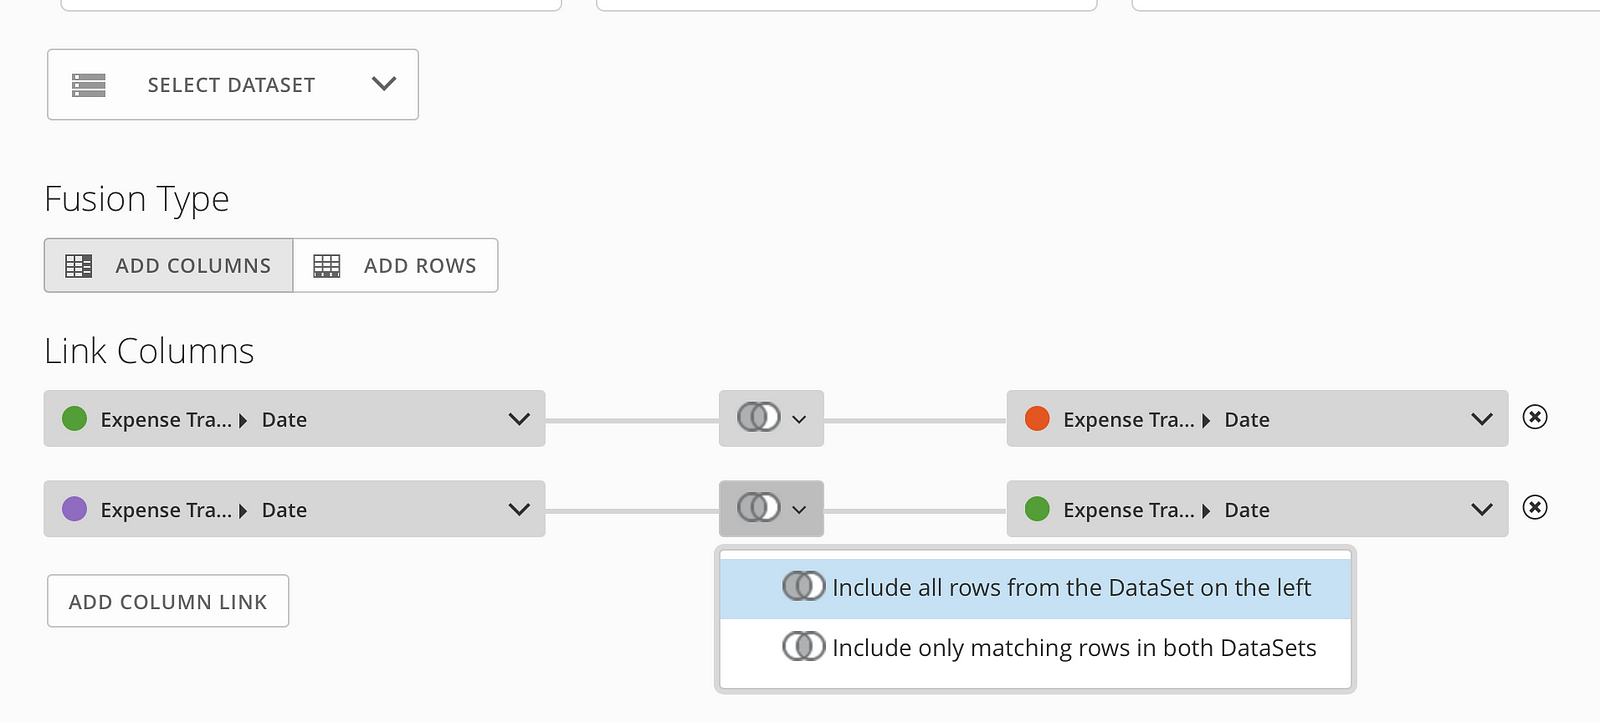
First, lets talk about loading data. Domo has a lot of connectors available: there’s a good mix of connectors for your company’s data as well as connectors for public data sets like Bureau of Labor Statistics or Twitter. For this post, we are just using Excel as our data source. Before we load an Excel file it needs to be in a format that can be queried, so click here if you want to learn more about this. I can load a single sheet in and do an analysis, but I have data in multiple sheets and want to combine them together. There are two different ways to combine data. First, we can simply join them, as demonstrated below:
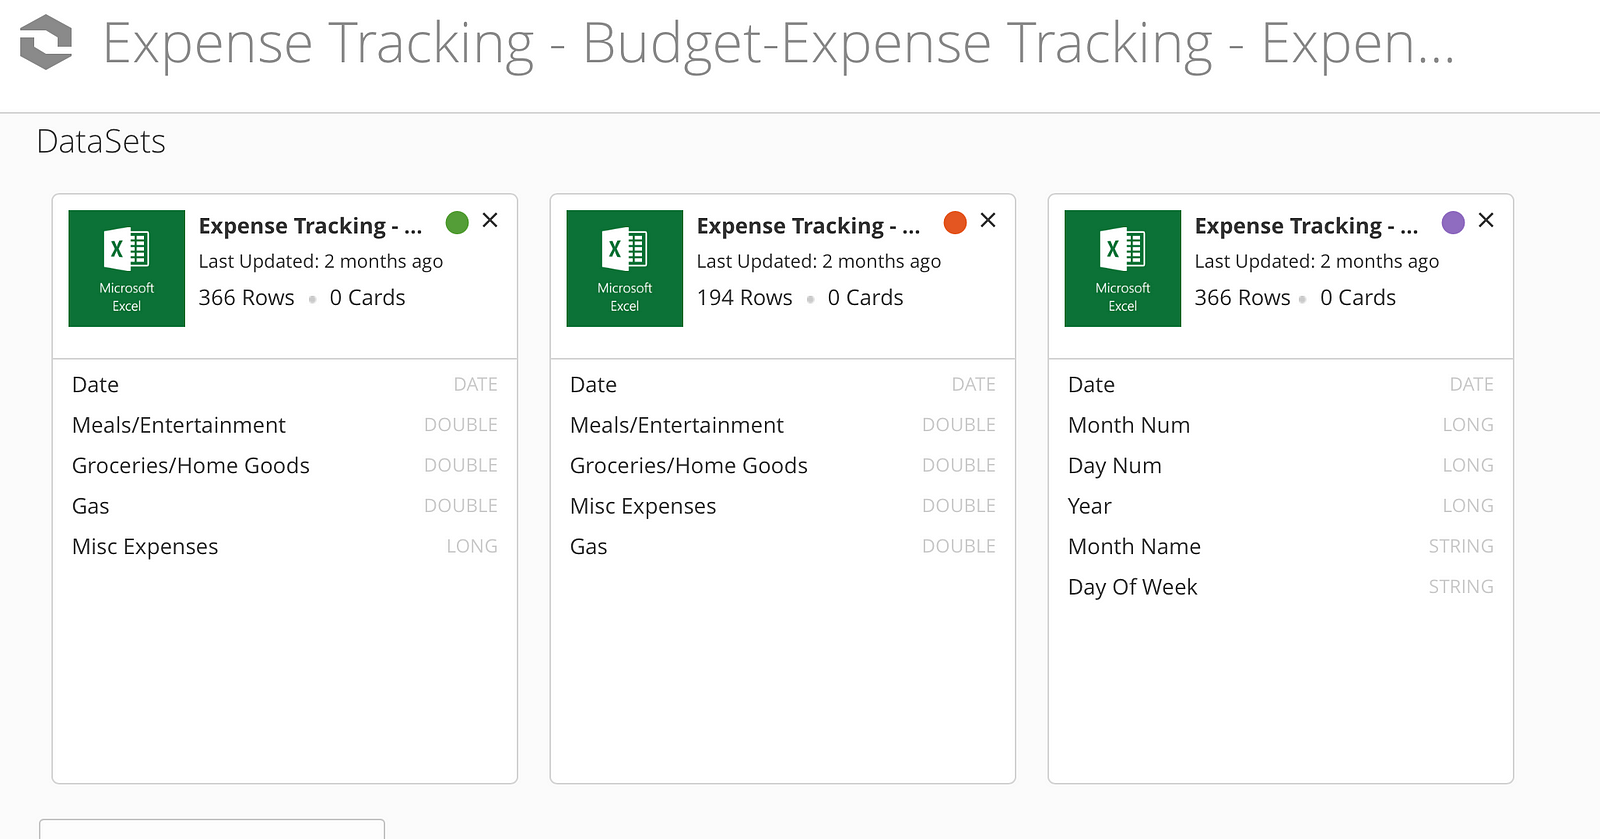
This option works well if you don’t need to do any transformations to your data and don’t want to add any additional fields to the final table. If you need to do more complex work in getting your data to the final state, you’ll want to use the second option, which is the ETL tool.
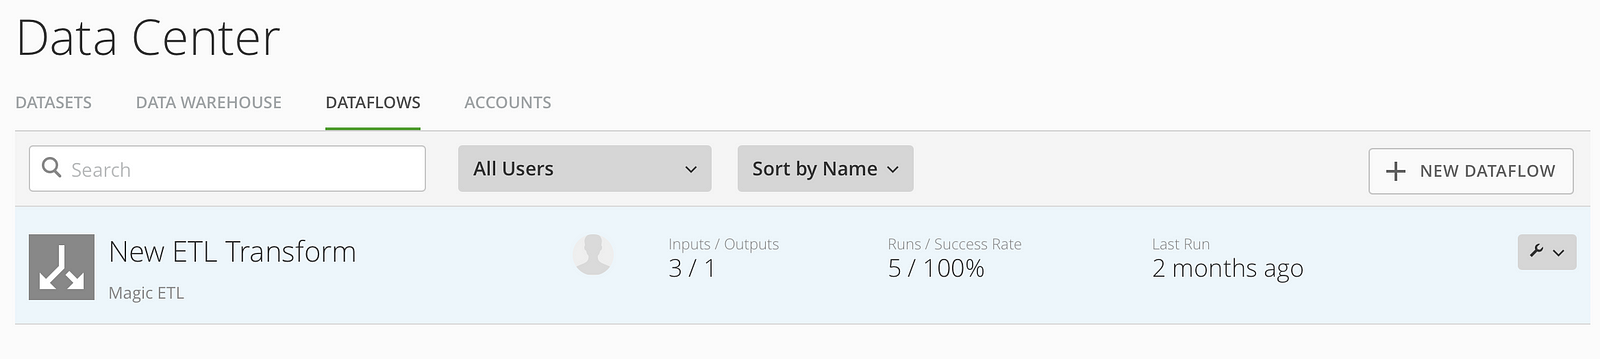
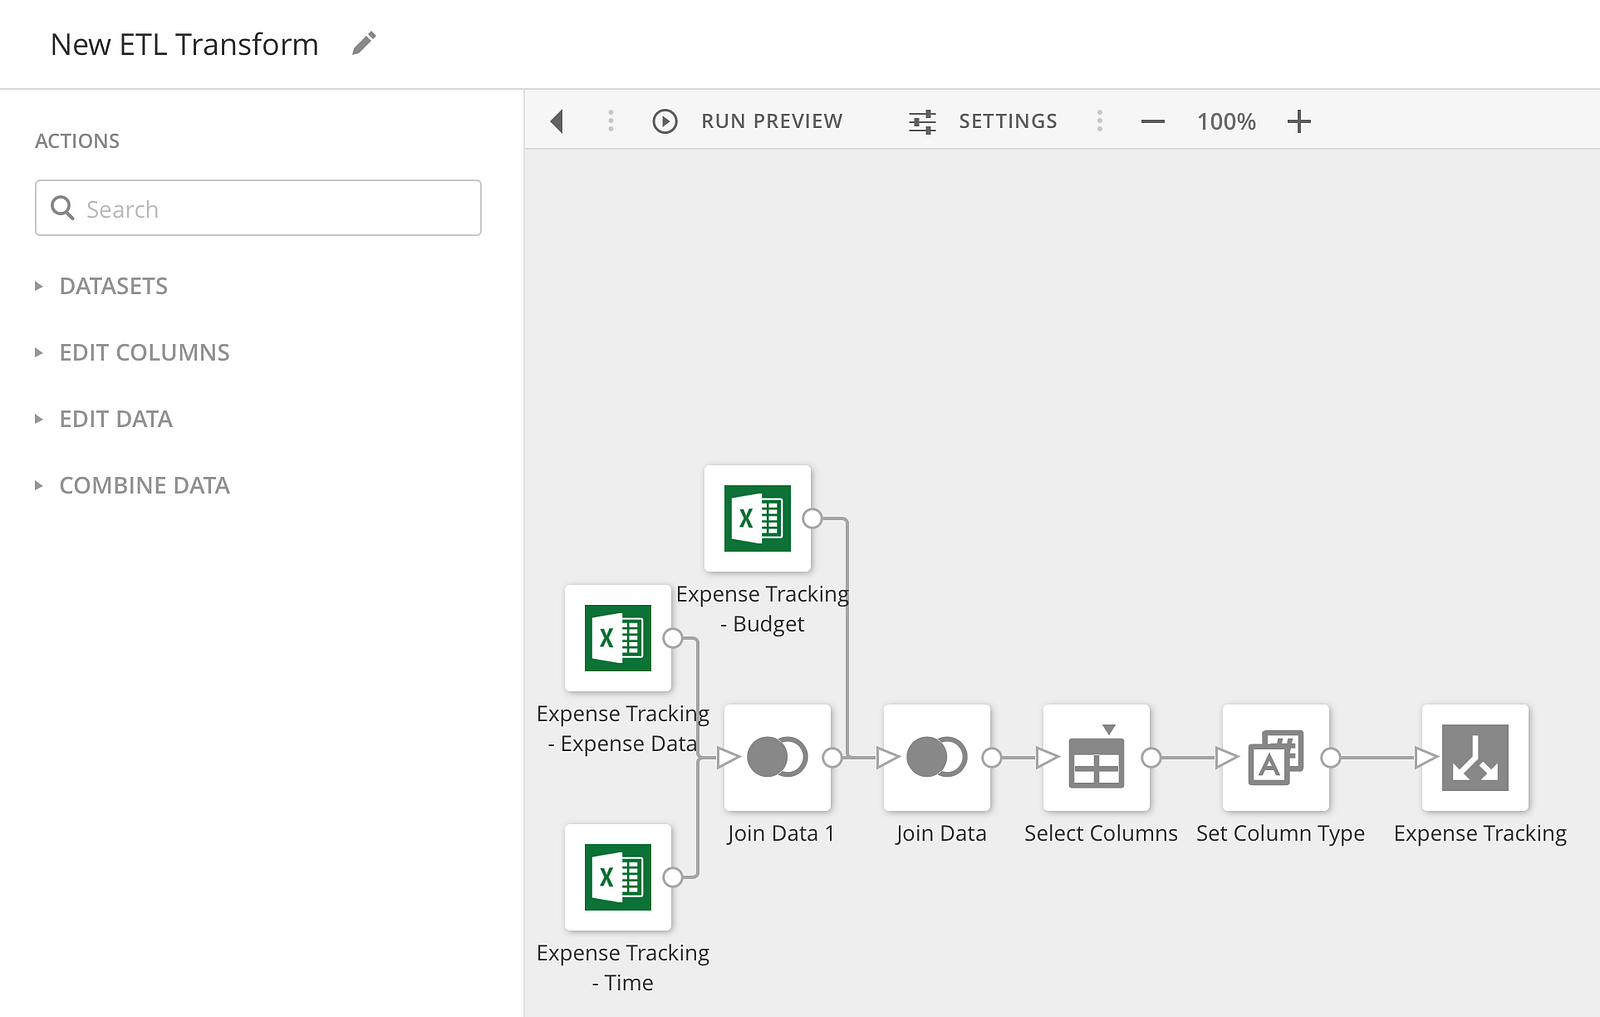
In order to create your ETL (Extract Transform Load) process, you will need to go to the DATAFLOWS tab and create a new Dataflow:
For the ETL Dataflow, I again used my three excel sheets as the source from the DATASETS drop down. From there, I can select from a variety of data editing and manipulation options to select from the other drop down menus. I found the ETL tool to be pretty easy and intuitive to use and is quite responsive, as is the whole Domo platform. However it has some major drawbacks. First, the functionality is pretty basic: you can’t add SQL filters or CASE logic, or use IF NULL expressions to transform nulls into zeros. The biggest draw back I see is you can’t add more than two columns together at a time; so if you want a column that is more complex you would have to build that metric up two columns at a time, or create that metric in the report later.
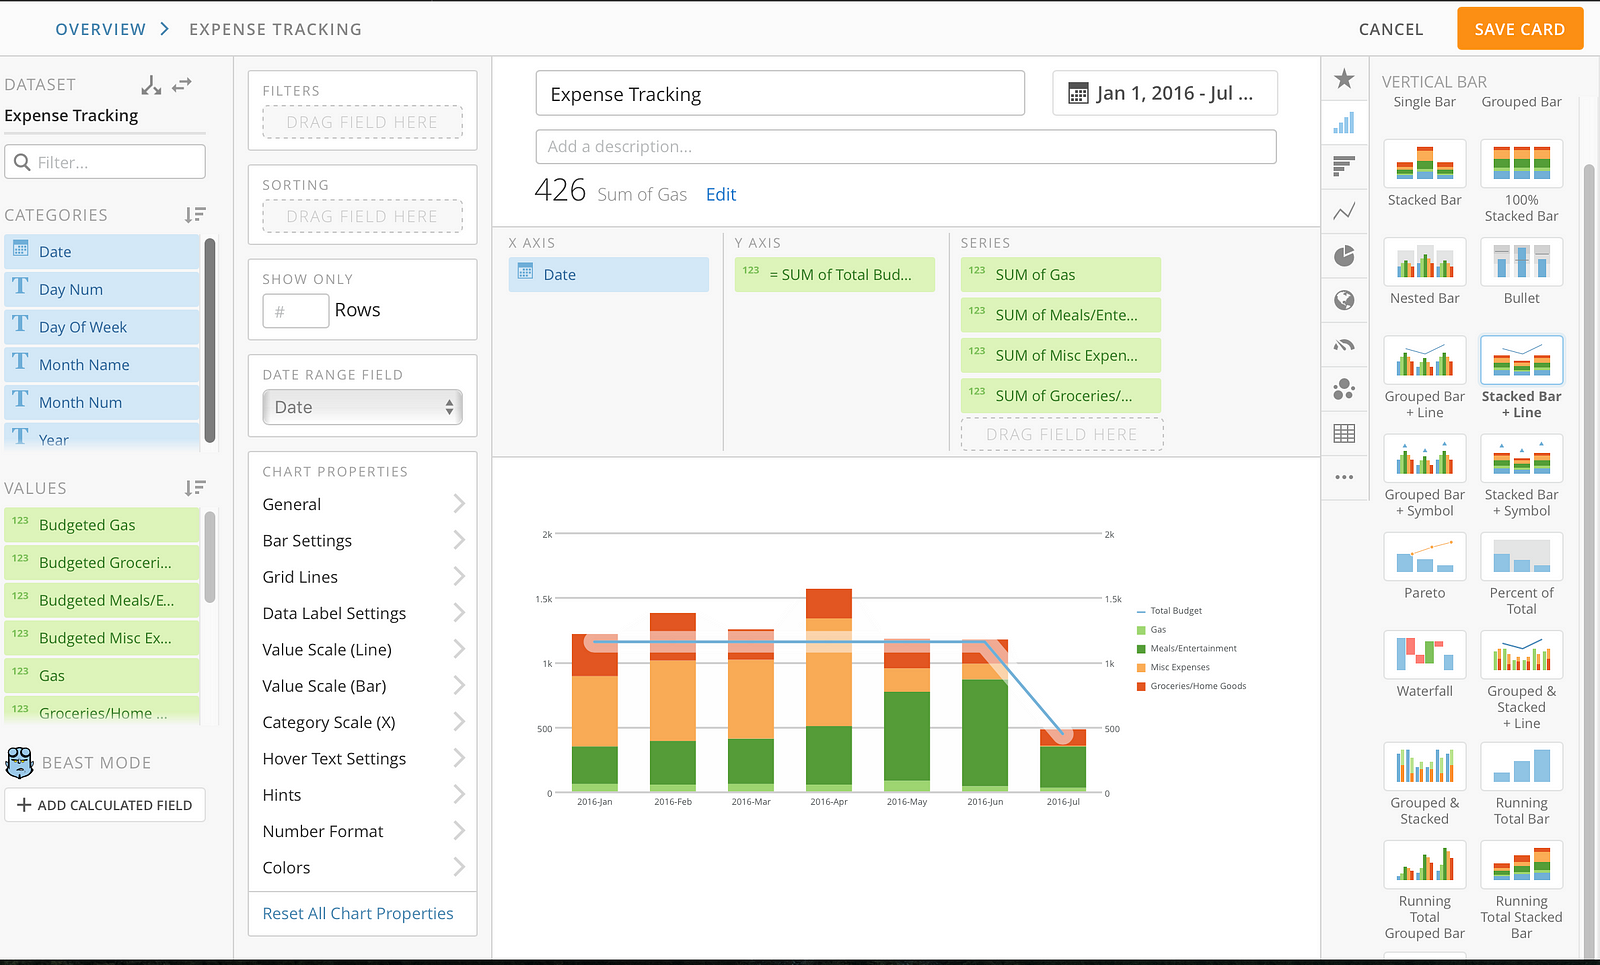
Now that our data is combined, we can create reports, or what Domo refers to as “cards”. I found the report creator very intuitive, responsive, easy to use and the charts are nicely interactive. One of the coolest things I found with the analysis tool, is for my bar/line chart where I did expenses to budget, I did not have a full month of data for July and Domo automatically filtered my budget line to the last date I had data for in July to show at that moment in time. This tends to be a little more challenging to do in other BI tools. There are a few drawbacks however to Domo trying to make things super easy for the end user. Domo, based on datatypes automatically assumes what is a “category” and what is a “value”. In my case I created time attributes in one spreadsheet, it put all of these in values, so in order to get them to be a category these had to be changed to a text datatype through my ETL. The other drawback is you can’t specify what folder you wan’t your attributes and values to be put in, so if you have a lot of values and attributes you just get a big list and there is no way to really order it.
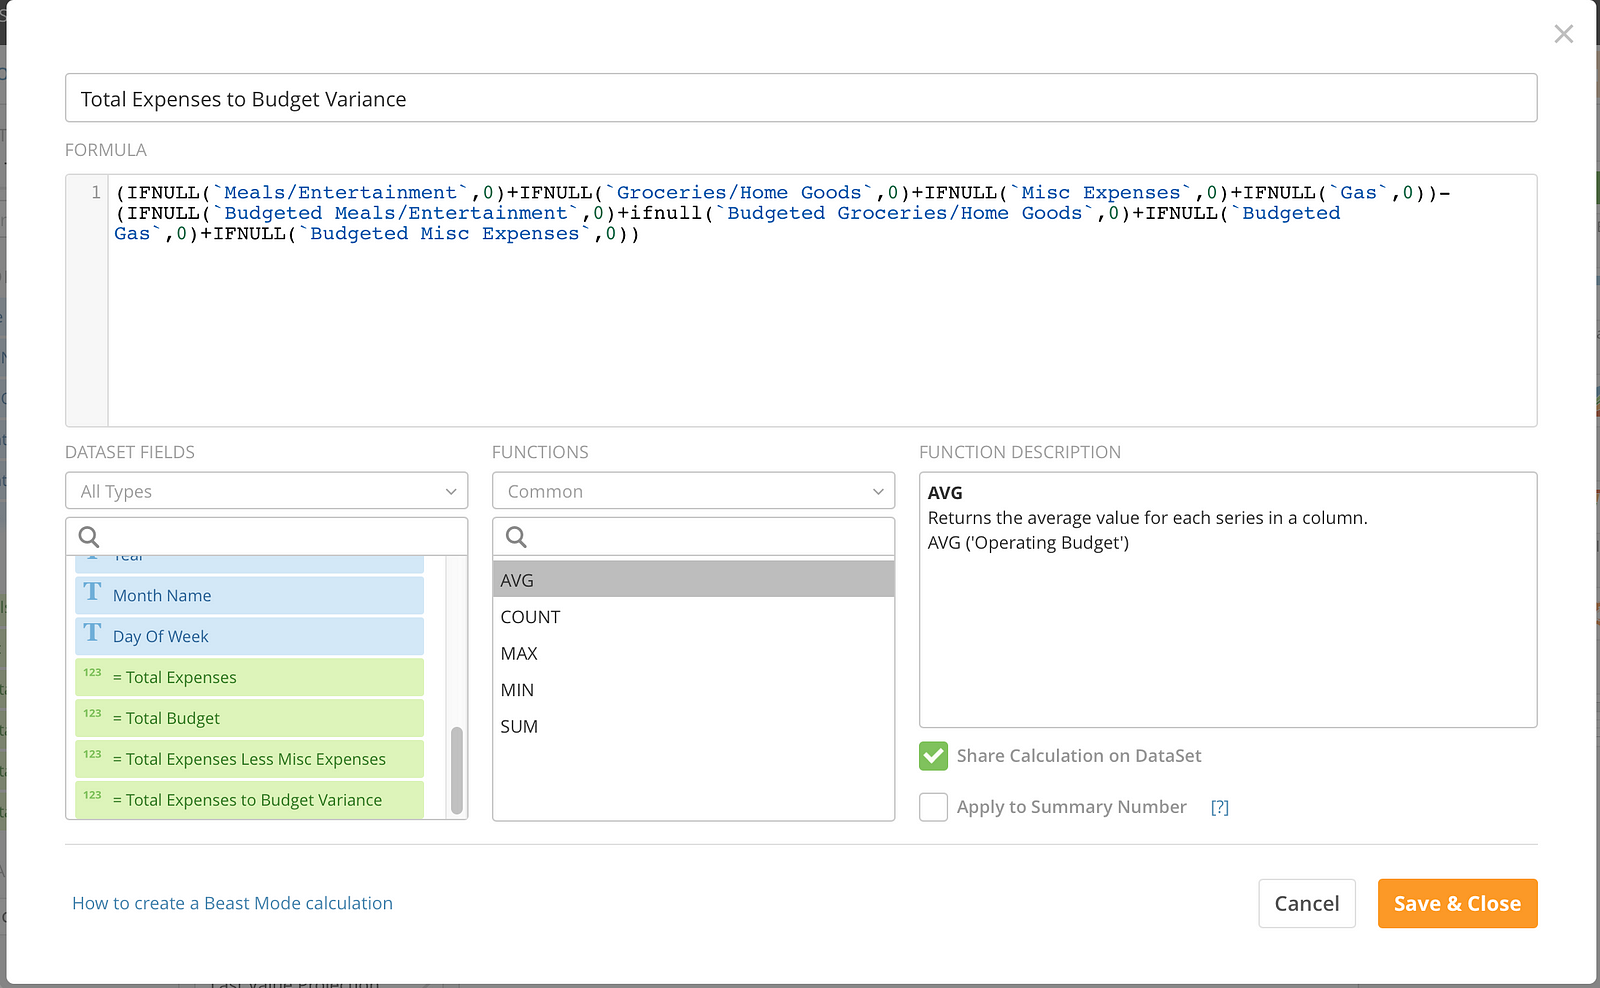
In case you didn’t get all of the columns you want for your analysis through ETL, or you want to combine columns, you can do this by going Beast Mode, which sounds a little Kitschy to me. The other annoying thing about this tool is that even though you name the metric you are creating, it shows up with “=” in front of the name to show it is a calculated field which looks a little messy in your Values field.
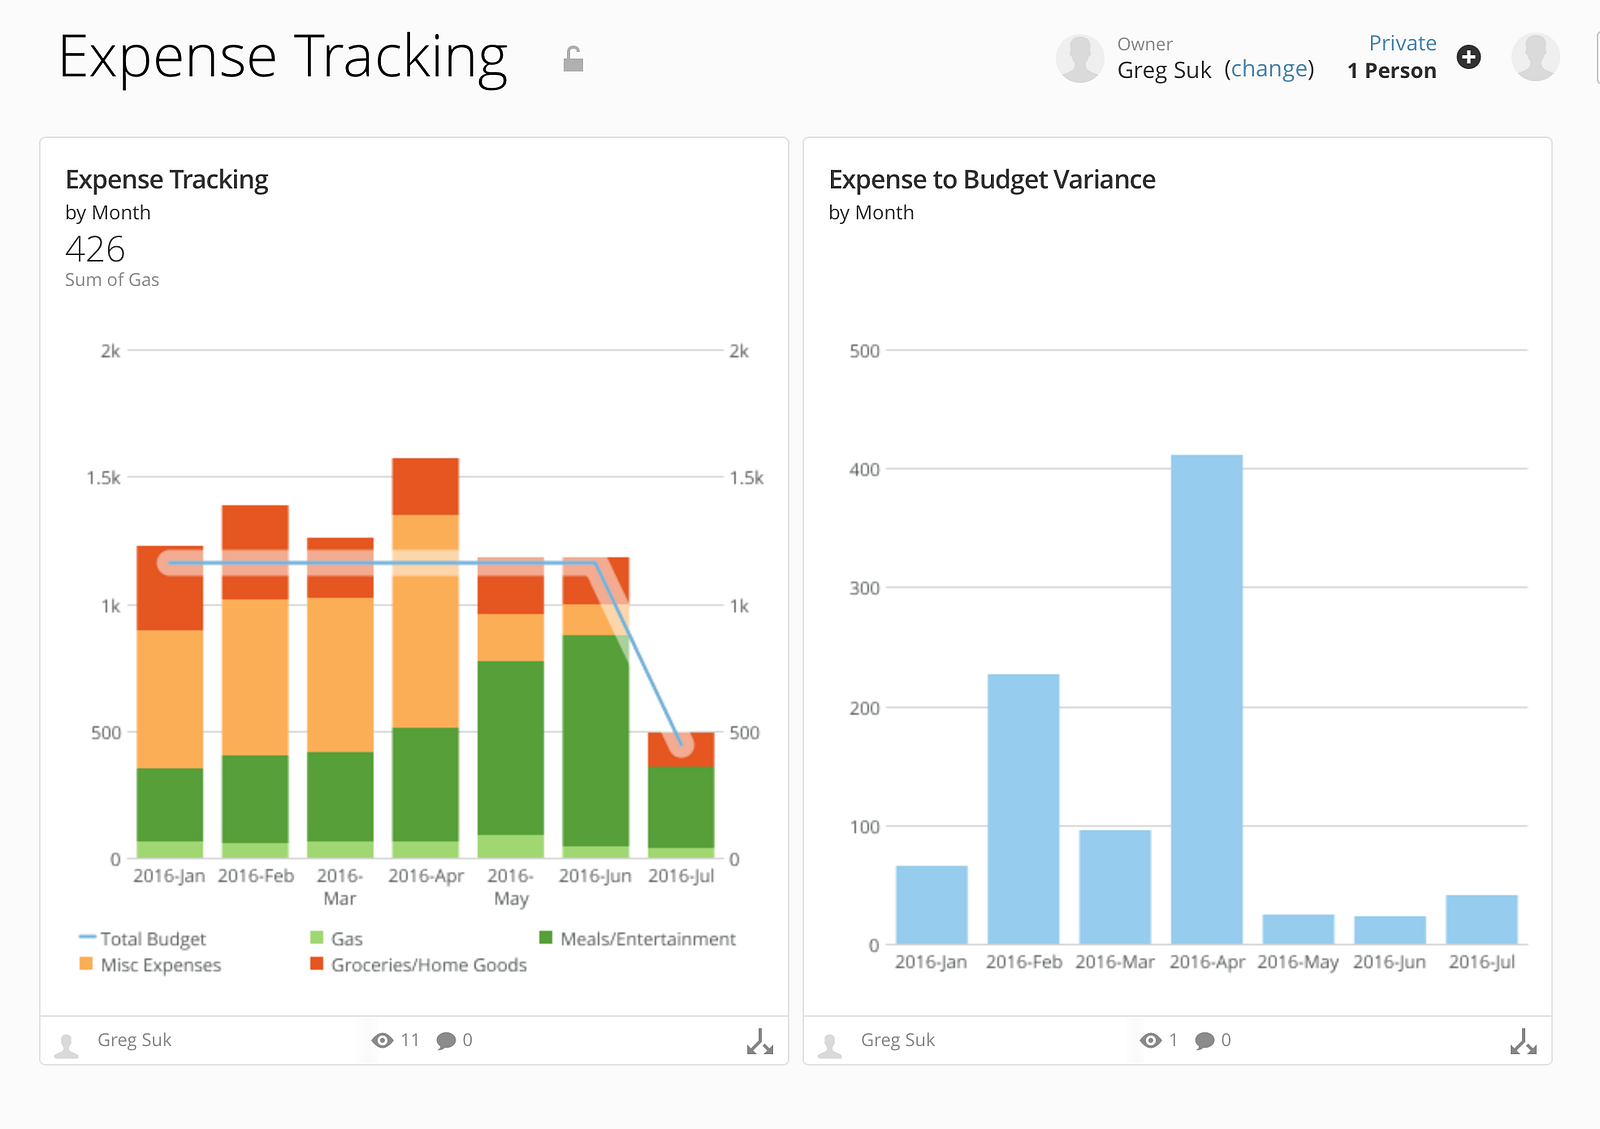
As you create reports, you can choose where to save them, as multiple reports get saved in the same place, this automatically creates a dashboard. You can apply filters to the dashboard like other BI tools that will constrain all reports, or click on an individual report and do a deep dive.
Getting back to the question in the title, I find Domo to be a decent BI tool for smaller subjects, as you saw the metrics and categories get quite busy and disorganized the more fields you add. However, if you want a tool that decides how you want your information to be displayed and makes it easy to use for even first time users then maybe you should have fear of missing out on Domo.