
[vc_row][vc_column][vc_column_text]
In this series I have been exploring various cloud Buisness Intelligence product offerings from companies like Domo and Tableau. Now it is time to review Oracle’s newish offering Business Intelligence Cloud Service (BICS).
First of all, if you are going to combine data sources for your analysis, versus having, say, a single spreadsheet to load, the easiest way to do this is Oracle’s Data Sync tool. If you are storing data in the cloud via Oracle’s Schema as a Service (SaaS) you can also use the ODI BICS KM, or PL/SQL or ORDS based web services in the Database to load data. Since I am just loading Excel sheets, I used Data Sync. Of the cloud BI tools I used with my Excel data set; the Data Sync tool for BICS is by far the most complicated to set up and learn to use. Part of this is because while tools like Domo and Tableau have data loaders built into the application or webpage, Data Sync is a separate download from BICS. Additionally, other cloud BI tools have no metadata layer to configure data, Oracle utilizes a traditional star schema design with individual tables in your data warehouse, which are then joined later in the metadata layer, similar to the on premesis Oracle BI platform. So from what I was able to figure out with Data Sync, it is used purely to get data from your source into the database. The other part I think, is it is just the way Oracle works, or WOW!
Part 1: Loading Data
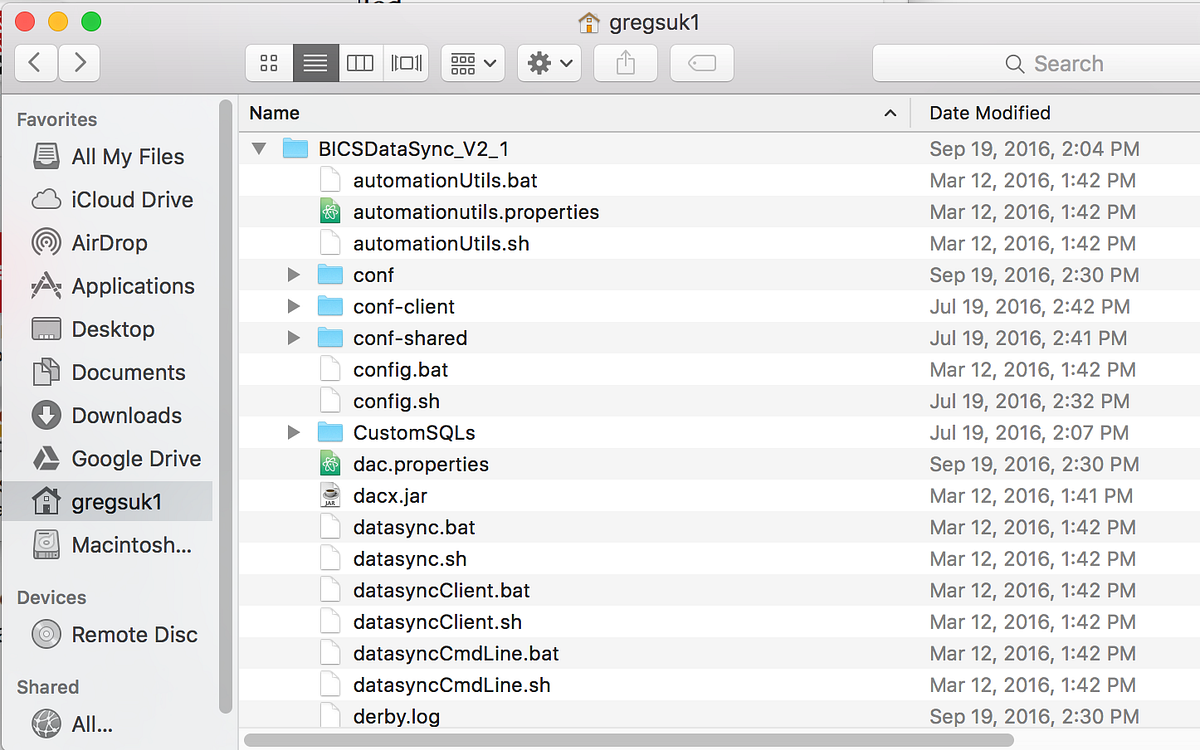
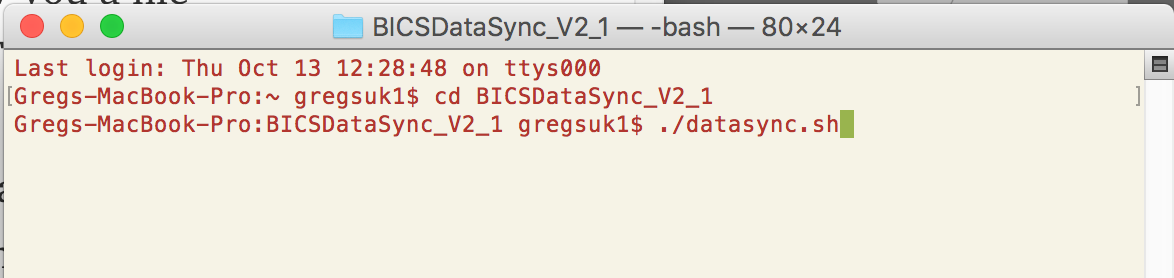
First, you will need to download Data Sync from the Oracle website. This will give you a file you need to unzip. The steps I am showing you are a little different between Mac and Windows, if you want more details of the download process and the instructions for Windows, click this link. Once you have downloaded this file you will need to run the install file datasync.sh in the command line. These files will need to be stored in a location that has no spaces, so I just stored in my user directory.
Once you have have run this file it will prompt you to set up your repository and a password. I have already done this so I just get the screen where you input the password.
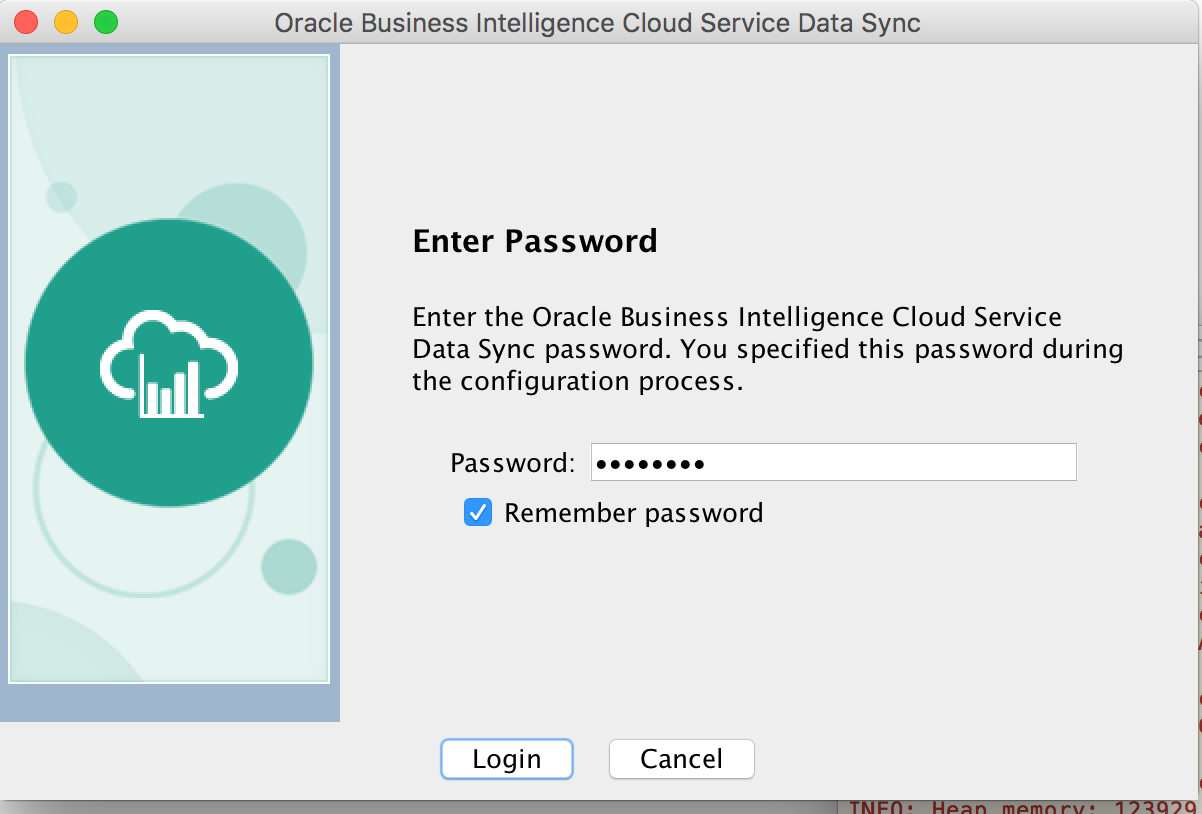
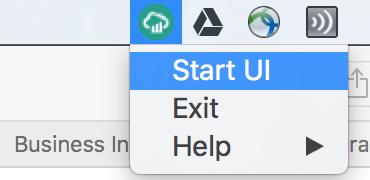
You will also get an icon in your toolbar that can be used to start the user interface if you have closed the window. However, if you exit out of Data Sync using the exit button below, this icon will go away and you will have to run the datasync.sh command again to start the UI.
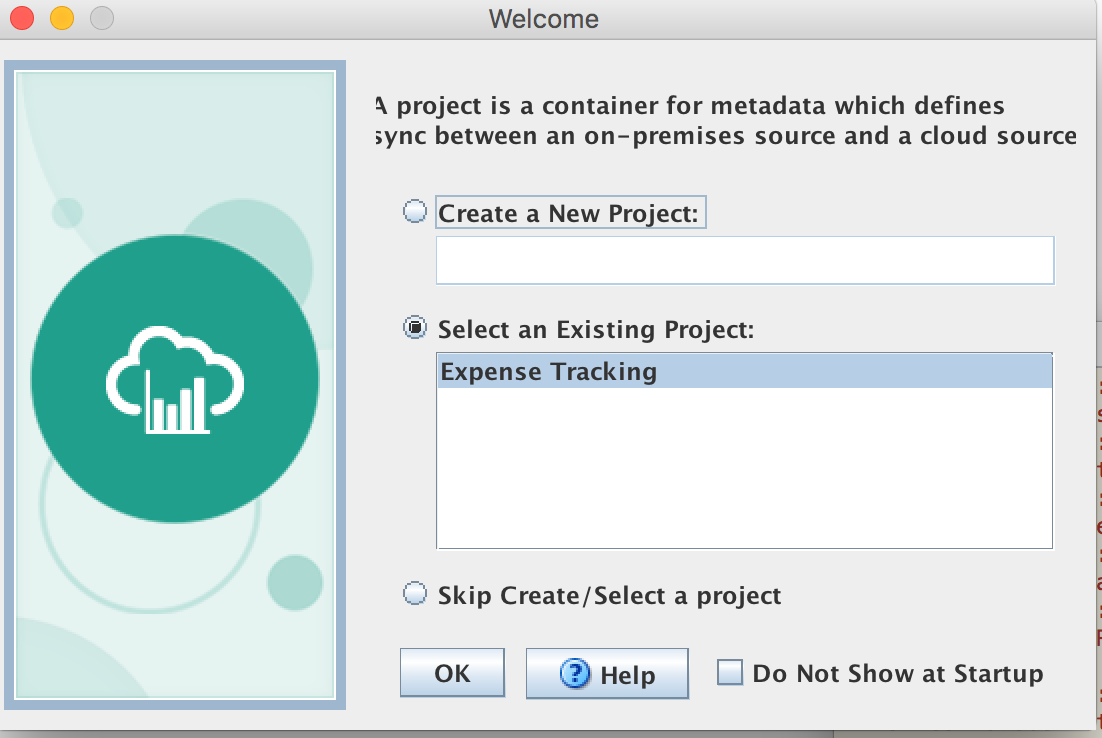
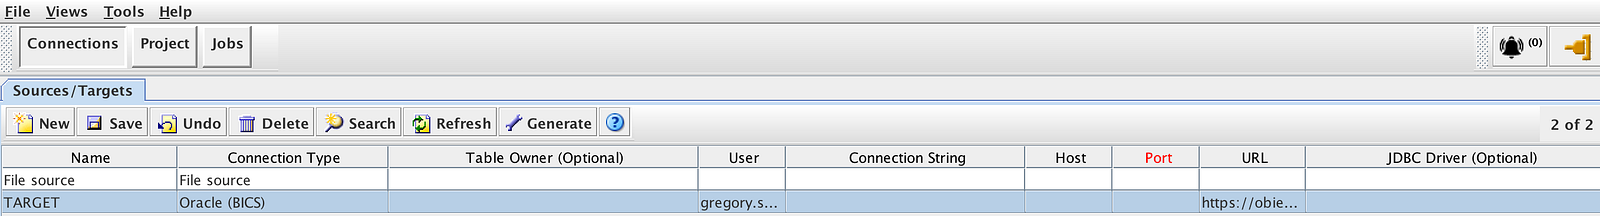
This tool is not integrated into BICS like some other cloud platforms. From here you will need to create a new project and define your connections. You will need to define the target (BICS) which just simply needs the url to your BICS environment, username and password. In this menu you can also define other sources, like Amazon Redshift, Twitter, Salesforce.com; or targets which could be another BICS environment.
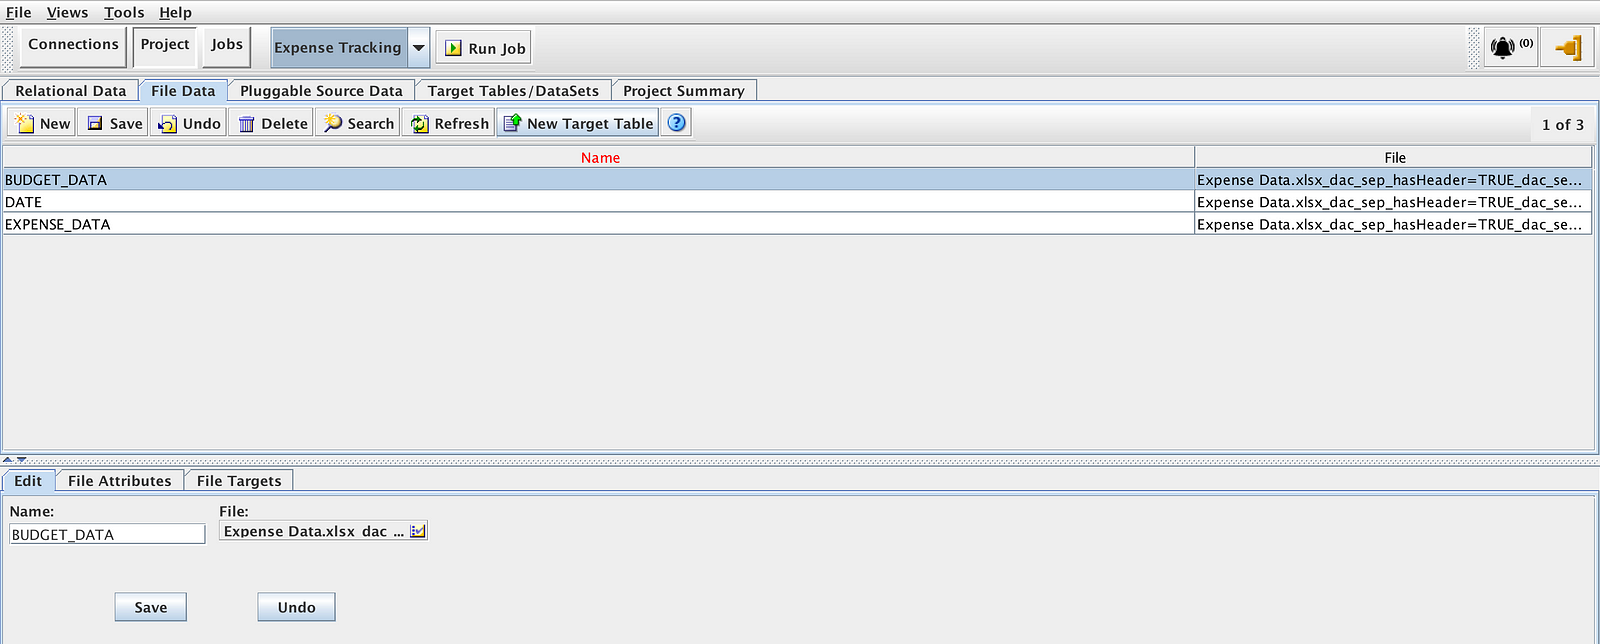
First I defined the file source, which for this example, was three excel spreadsheets. If you would like to read about formatting Excel spreadsheets for this purpose, click this link.
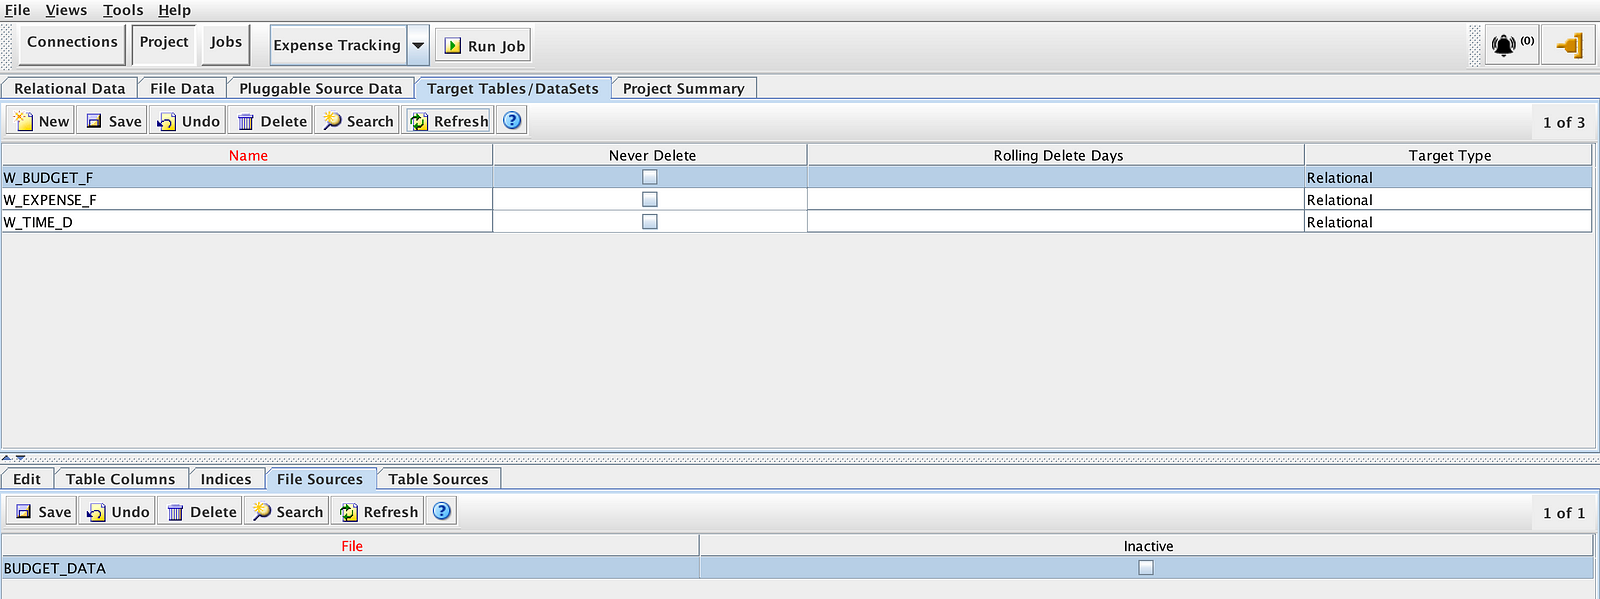
Once the files have been loaded we then specify the target table. I followed general data warehouse nomenclature in naming my target tables. These tables will then be joined together in the data model in BICS. Once everything is set up satisfactorily we can then select Run Job to populate BICS.
Whats my opinion of Data Sync? In it’s current state, I am not very impressed. From what I can see Data Sync doesn’t give you any options to merge multiple datasources, for example if you have data coming from Salesforce.com and you need to add keys to it to work with other tables, you can’t do that. So you will still need a full ETL tool like Oracle Data Integrator. So while I like the fact that this tool gives you separate tables which you can then manipulate later in the data model (unlike the “flat files” of Domo and Tableau), given its relative lack of functionality it makes the learning curve and installation challenges seem unnecessary, given how easy it is to do this in some of the other BI cloud offerings.
Part 2: BICS Data Modeler
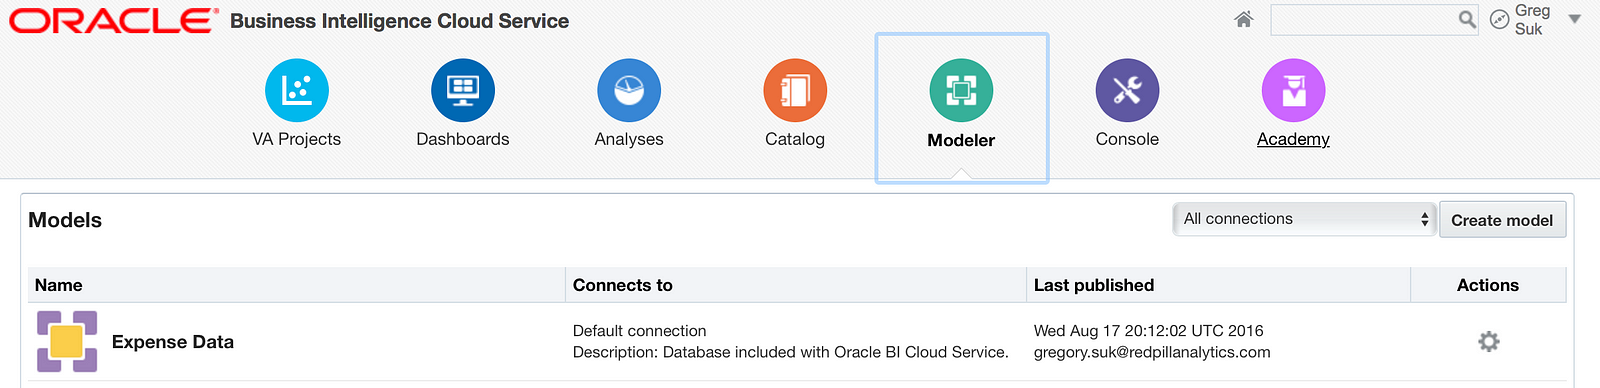
Now that we have our data loaded we can go to BICS and click on the Modeler tab. Here we will want to select “Create Model”
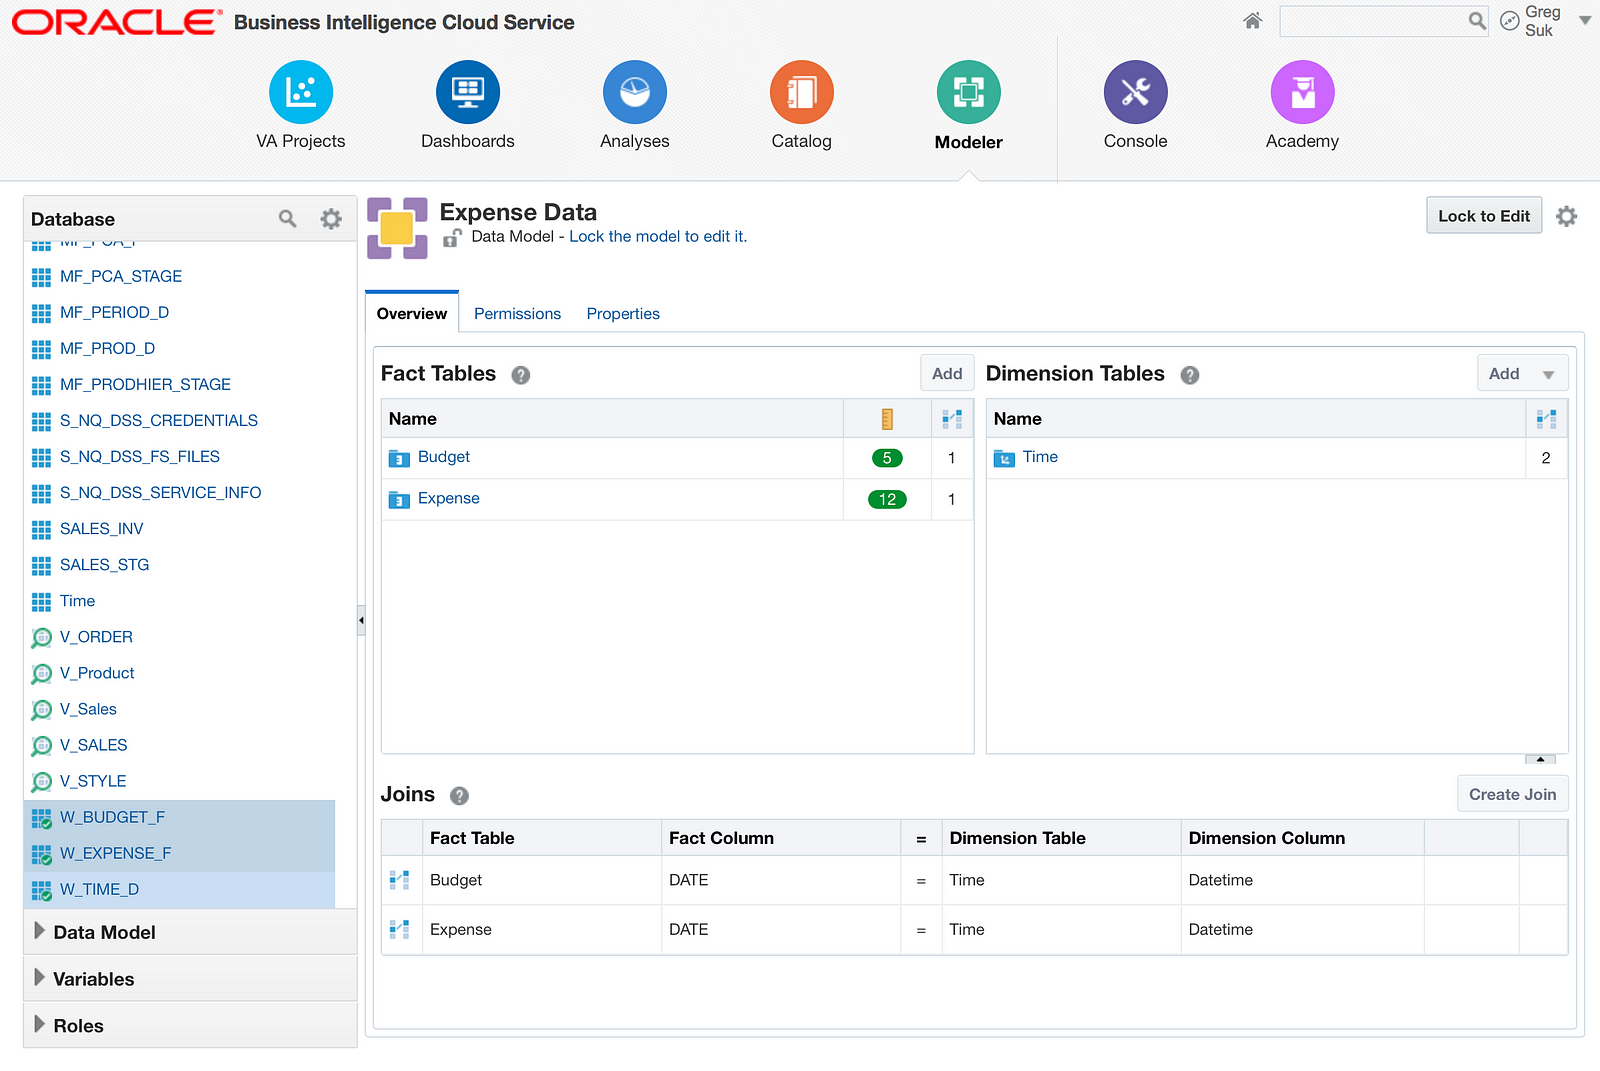
Now that we have a new model it is time to add our Fact Tables (tables that contain fields you want to measure) and our Dimensions (how you are measuring). As we can see here I have a pretty basic data model with only one dimension (time) and two facts. What I really like about this modeler, that you don’t get in a lot of other BI cloud offerings is the ability to create calculated fields here and the ability to create presentation folders to organize your metrics and attributes however you want them. Let’s say I didn’t want all of the 12 measures from Expense in the same folder, I could create a new folder that made more sense for those metrics, even though they come from the same database table as the other expense metrics.
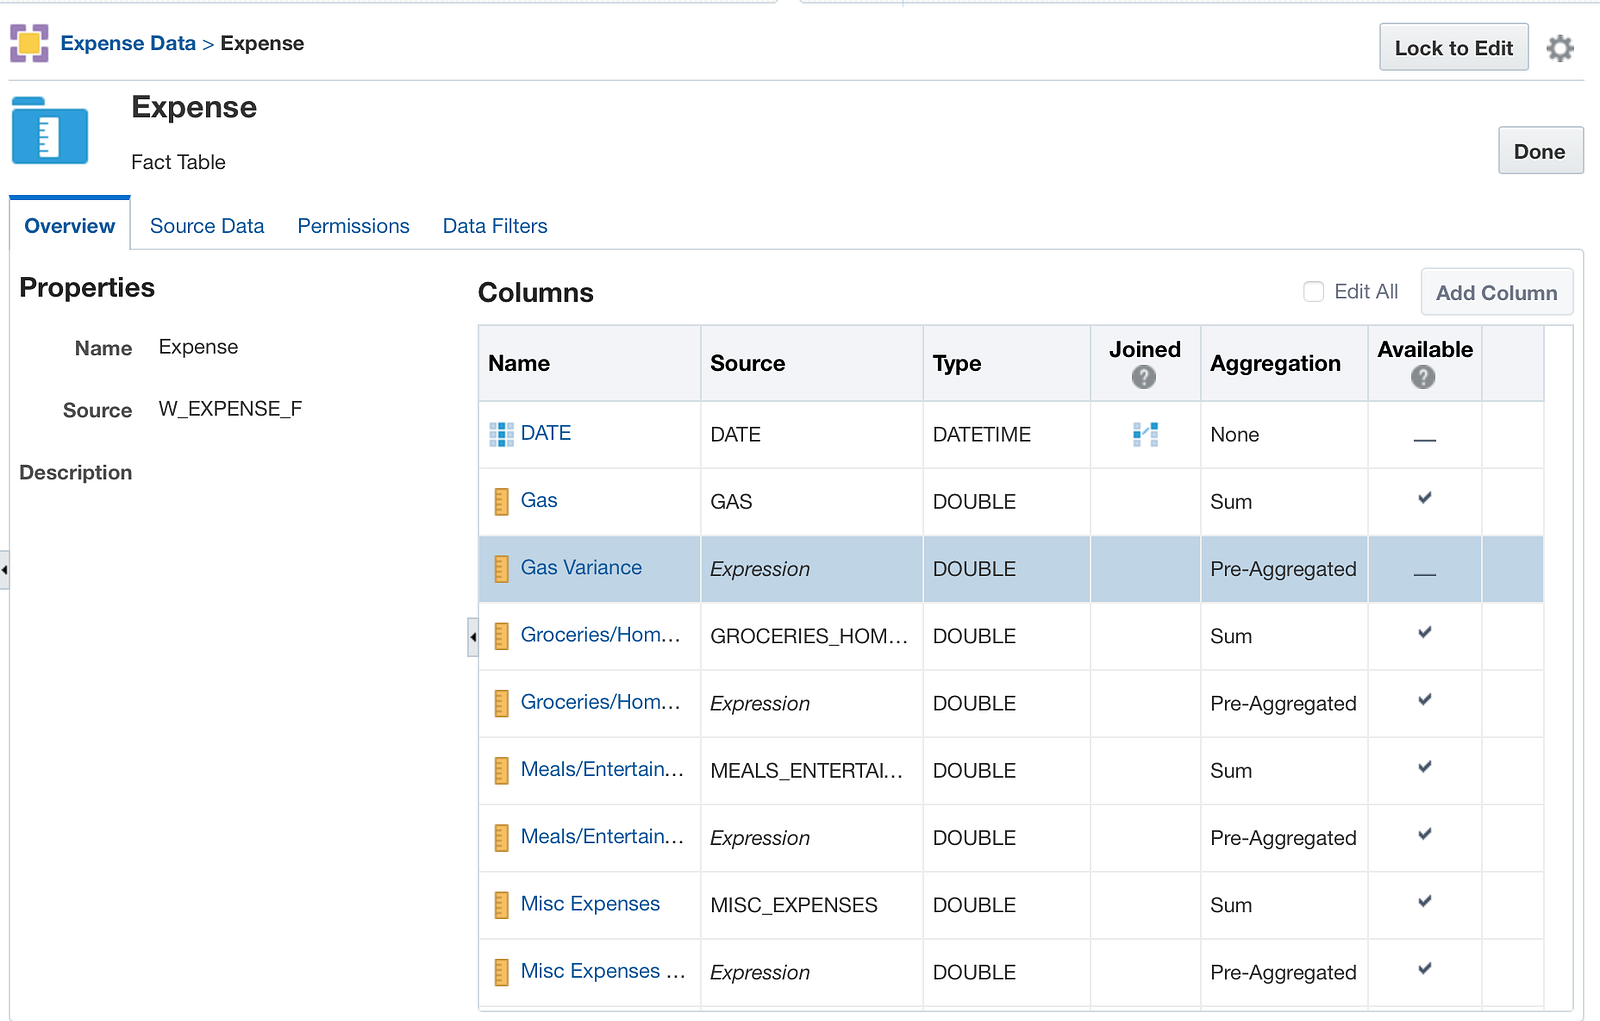
Here I have created a number of metrics based off the base metrics in my table, like expense to budget variances at different levels. By doing this here these will be available any time anyone uses this data model for an analysis. You could create them later while creating the analysis like Domo or Tableau, but this way they are done prior to any user performing an analysis from this subject area.
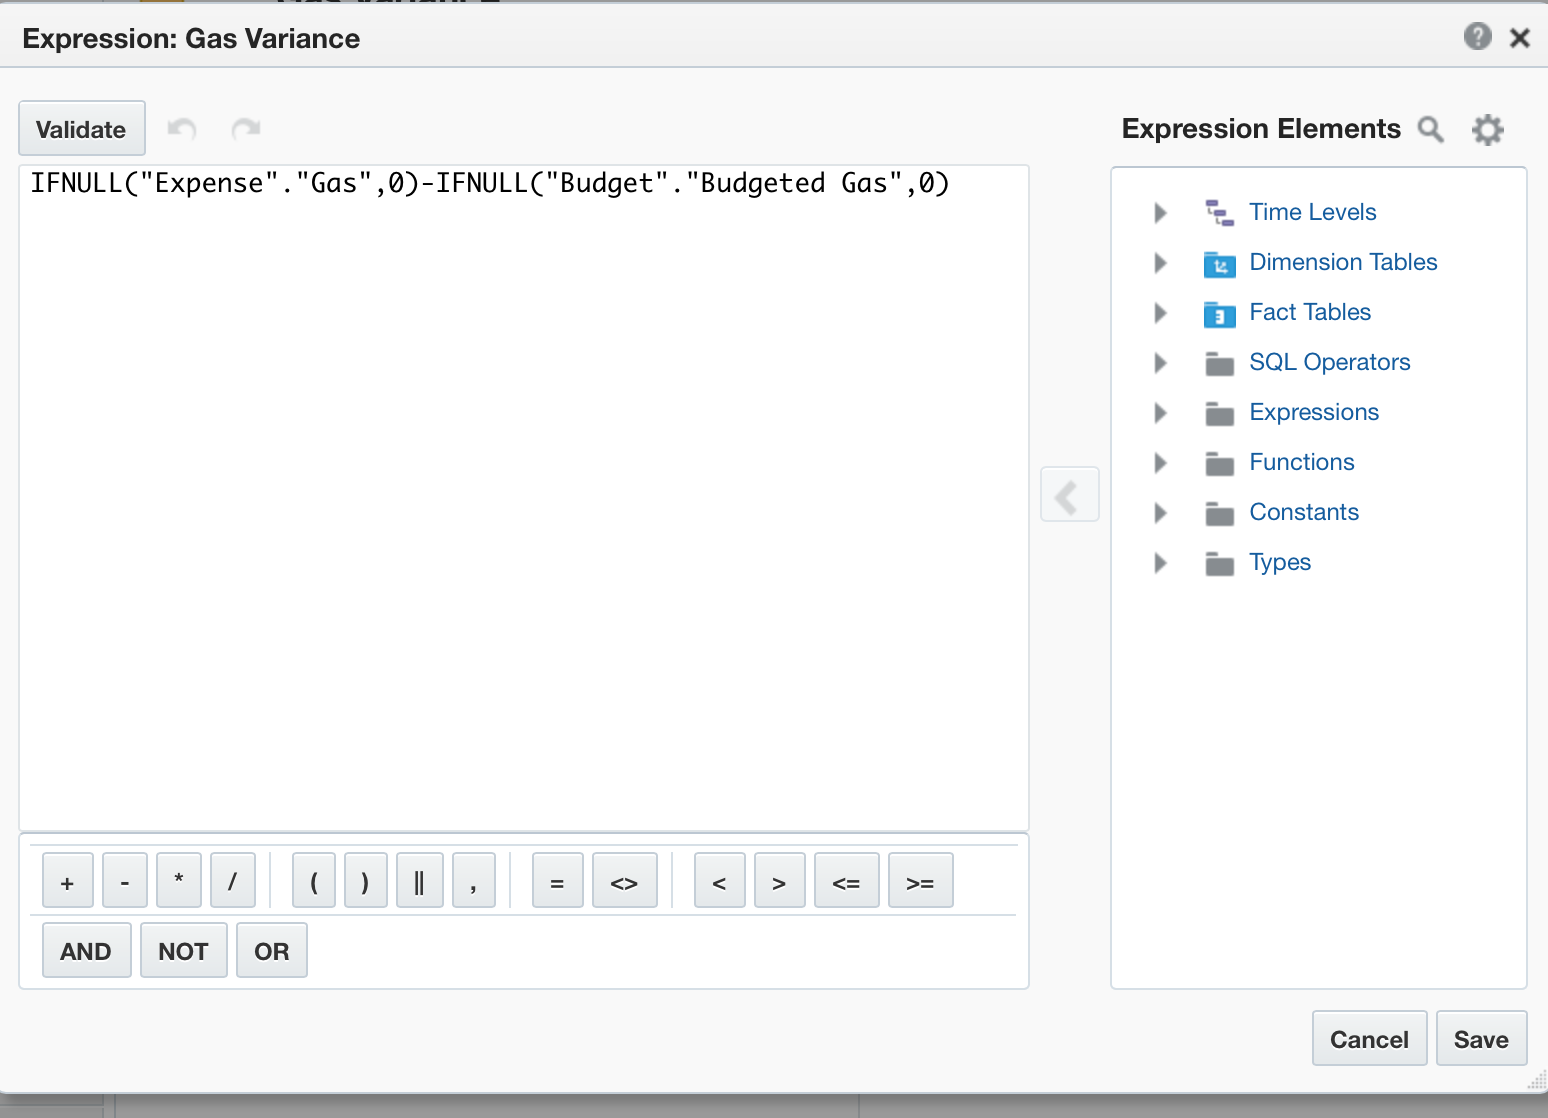
Here is and example of a basic expression you can create, but you also have the ability to create much more complicated expressions in this window as well.
Overall I really like the data modeler in BICS. It gives you the most control of what you want to do with your data and how to display it of the BI cloud tools that I have used so far. The other really nice thing is it comes with a built in time dimension that I could add to the model had I not created my own in Excel version and then uploaded that and would have provided much better time functionality. The main drawback to the data modeler is that it seems Oracle didn’t take full advantage of cloud computing, which is instant saves; so if you haven’t saved your data model and you get timed out, all of the unsaved work is gone and you also can’t save the model if there is an error in it.
Part 3: Performing Analysis
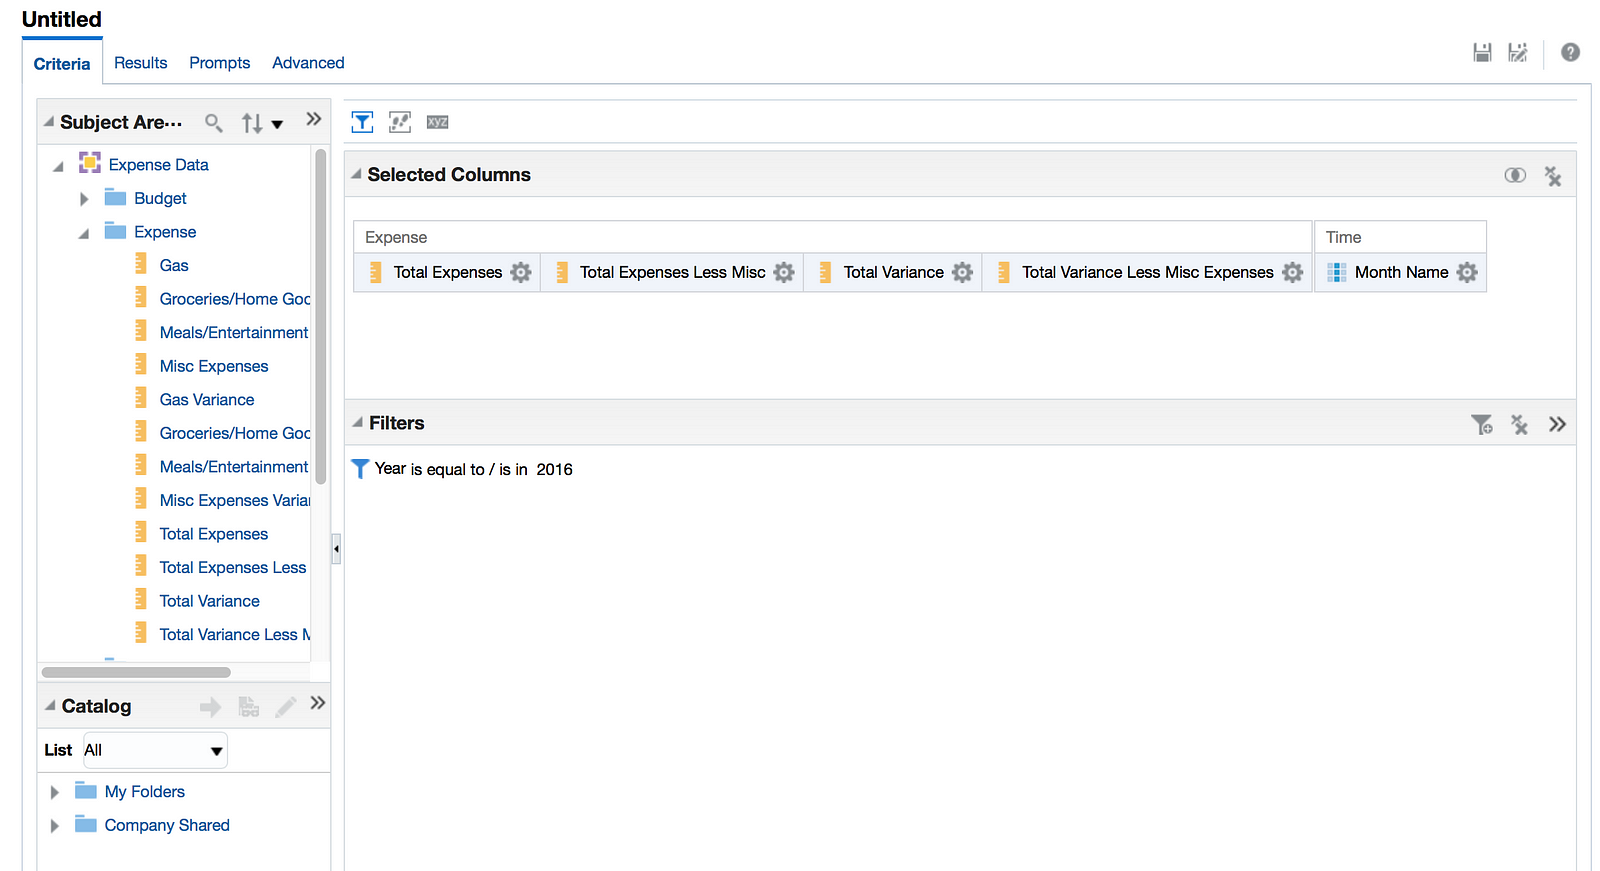
Now it is time to make an analysis.
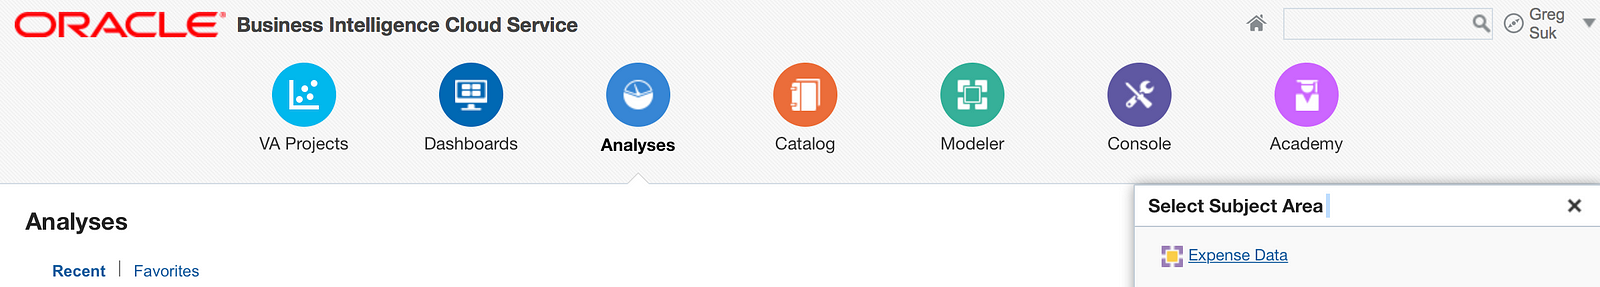
For anyone that has used Oracle Business Intelligence Enterprise Edition (OBIEE), this will look very familiar. You can add multiple visualizations to the analysis like, table, graph etc. However you are limited like in OBIEE to only making views based off of the criteria selected for the one analysis.
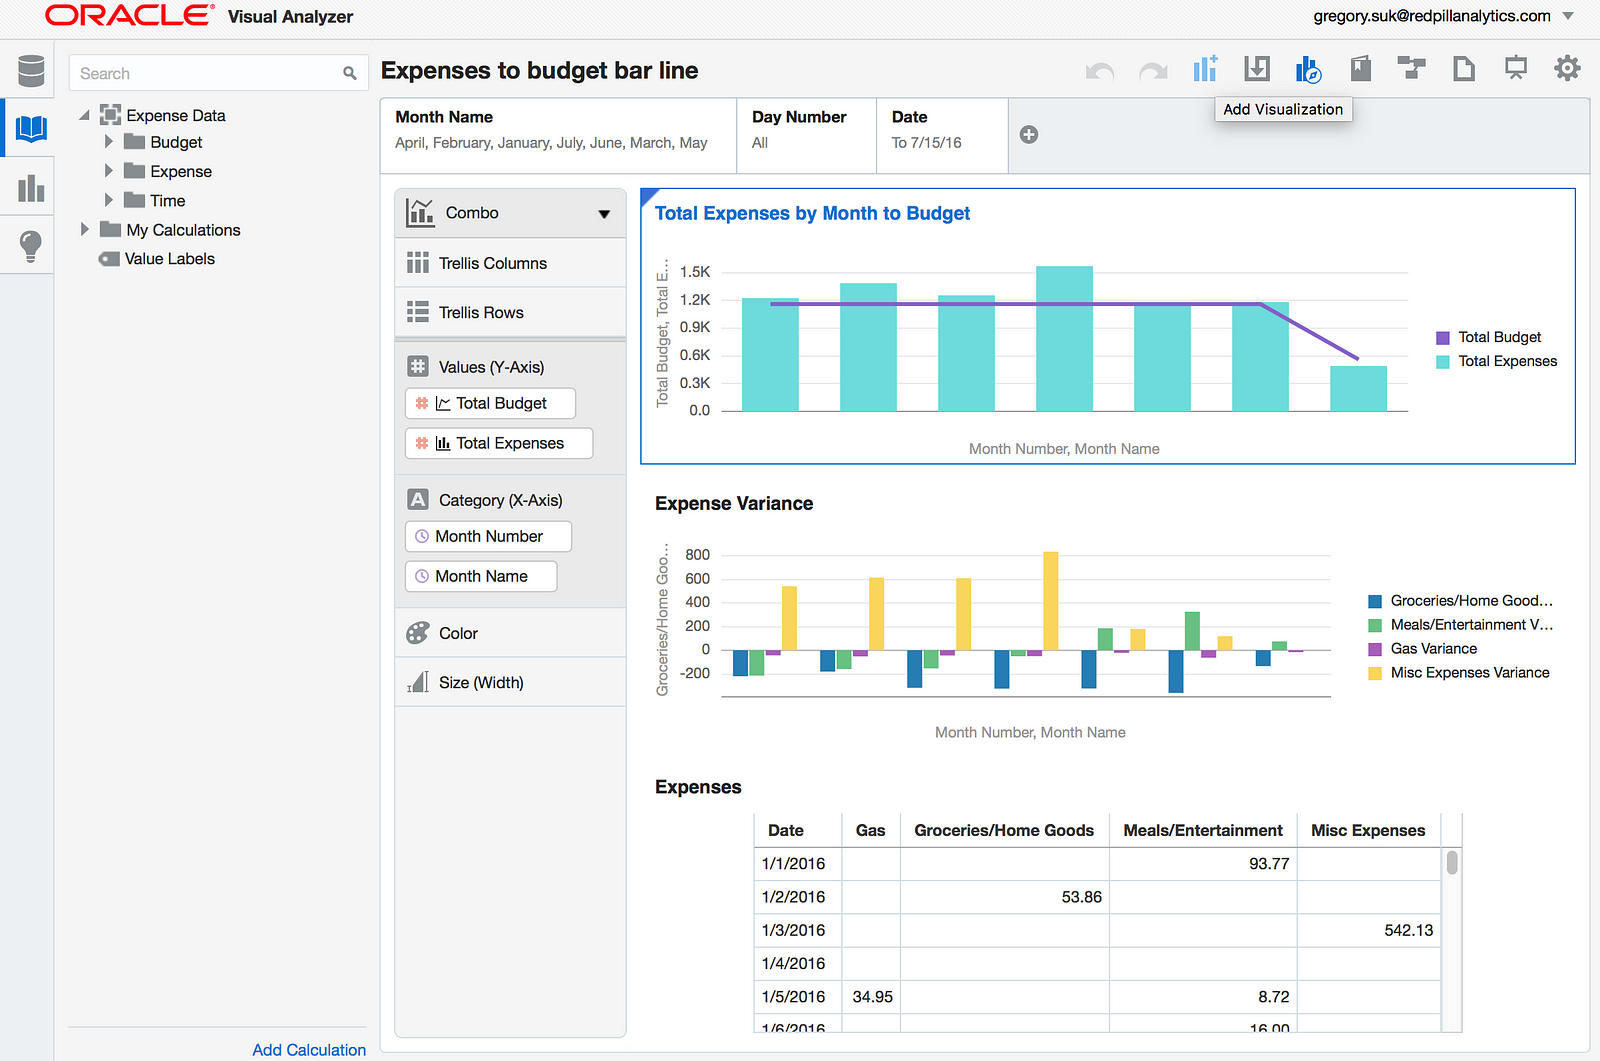
Because Oracle BI is rooted in content curated for the user but trying to move more toward user generated content like other cloud BI tools, BICS also includes Visual Analyzer (VA). VA gives users the ability to add data sets directly to the analysis, without having to select a pre-made subject area like in the analysis tab. However, if you are adding data this way you can only use a single excel spreadsheet or other datasource, there is no ability to combine data sets that haven’t alrady been created in the Data Modeler for the user. VA does gives you the ability to add multiple visualizations to your project that have different values and categories, thus creating a sort of dashboard like Domo. Unfortunately, these analyses can’t be added to a traditional BICS Dashboard the way that a regular analysis can.
In the end I think BICS is a pretty strong offering, for a larger company with more complex data, or a company that wants their data in large part to be curated for the user, with some ability for users to add their own data. If your purpose is to give all of the power to the users from uploading data and creating metrics this is probably not the way to go. Some of these cons may be addressed with the next major release, which is likely coming later this year.
[/vc_column_text][/vc_column][/vc_row]