This post is part 4 of 4 about using the Baseline Validation Tool (BVT) with Oracle Business Intelligence (OBIEE). The previous posts are:
Interpreting the BVT Results
As described in my third post in this series, here’s how to find the BVT test results:
- After you run the –compareresults command, the results of the comparison will be stored in a folder in your oracle.bi.bvt folder called Comparisons.
- The next level will contain a folder with the two deployments that you ran the comparison against.
- Within that folder you’ll see a folder for each test plugin that you ran. Finally you’ll see an HTML file named after the plugin (ie. ReportPlugin.html, CatalogPlugin.html, etc.) which is the gold at the end of the rainbow that you were searching for.
- Open this HTML file in a web browser.
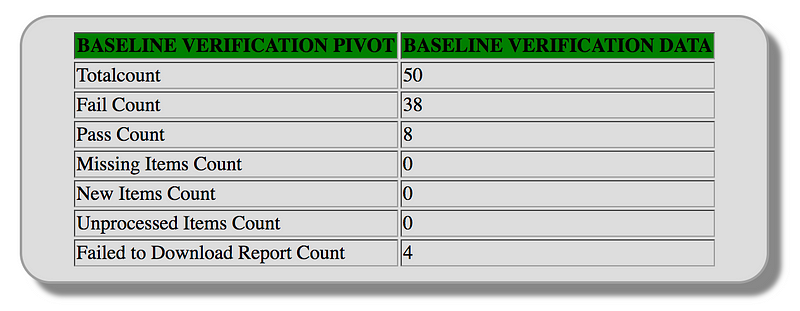
When reading any of your result html files, the first section will be a summary of what was found.
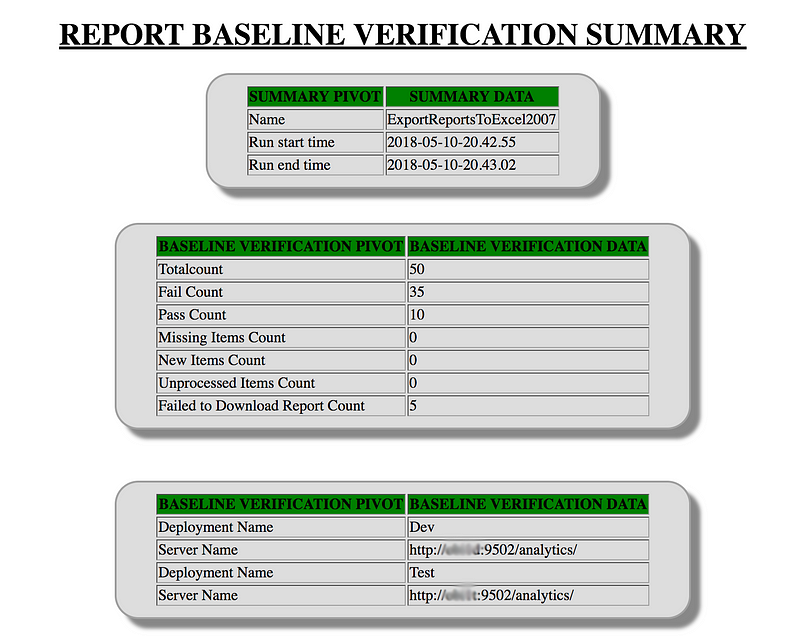
You’ll notice that in the results tables that I describe below, there are columns for First Deployment and Second Deployment. Image 2 (inline) These correspond to the order of the deployments that you gave when you asked to compare results. If you look at my example from above, my first deployment refers to what I named Dev and the second is Test. These correspond to the order I entered the deployment results when I compared the results:
bin\obibvt.bat –compareresults SST_Report_Results\Dev SST_Report_Results\Test -config Scripts\SST_Report_Test.xml
The results will then be grouped into section categories based on the result of the test. The report name will be given but unfortunately the path is not included. If you hover over one of the SERVER LINKs you’ll see the path on the OBI server to the report so you’ll see the folder path within the Catalog there but it’s not easy to read. This is another reason why I like to run BVT on each folder individually because the results can get messy on really large folders with many stakeholders who care about the BVT results.
Catalog Test
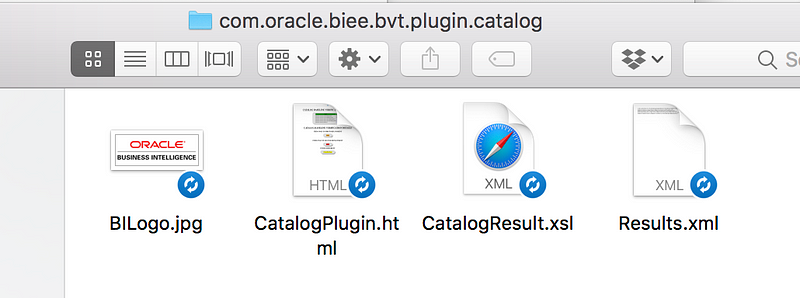
You’ll find the Catalog test results in the comparison folder then in the folder named with the two deployments that you were comparing (“Dev — Test” in my example). Then in the folder called “com.oracle.obiee.bvt.plugin.catalog”, open the HTML file called CatalogPlugin.html.
The results of the Catalog test do not include a “Passed” category like other tests. You can assume that if a report does not show up in any of the 3 possible categories that it was identical in both instances.
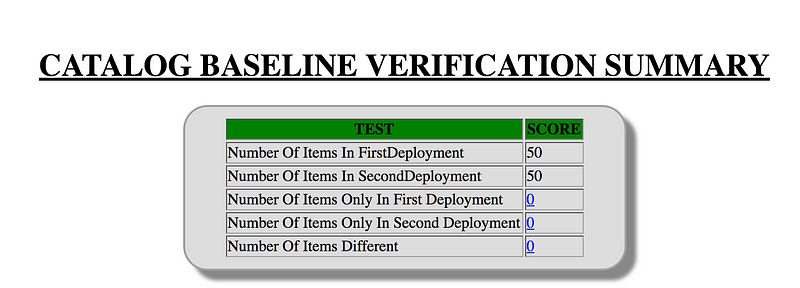
The sections you’ll find in the Catalog Plugin Test results are the following:
Items Only in First Deployment — These are reports found in your first instance that you tested but are not in the second.
Items Only in Second Deployment — These are reports found in your second instance that you tested but are not in the first.
Items Different — These reports were found in both instances but something was different between them. The Name column will tell you what was different.
Acl means that the users with access to this report are different. This is because a server specific user id value is used so if you are comparing reports on different servers, you would expect these to be different.
Report Test
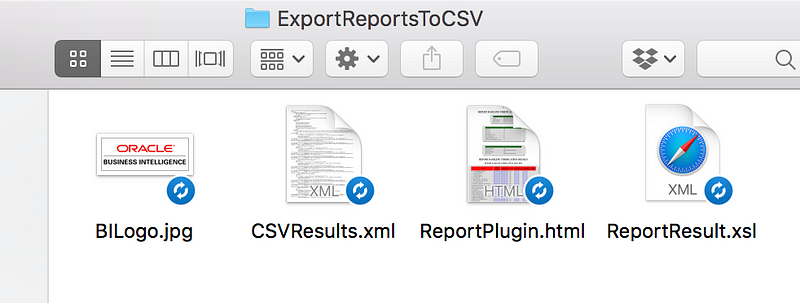
You’ll find the Report test results in the comparison folder then in the folder named with the two deployments that you were comparing (“Dev — Test” in my example). Then you’ll see folders for each type of export that you could have done for the Report test which includes CSV, PDF, and Excel.
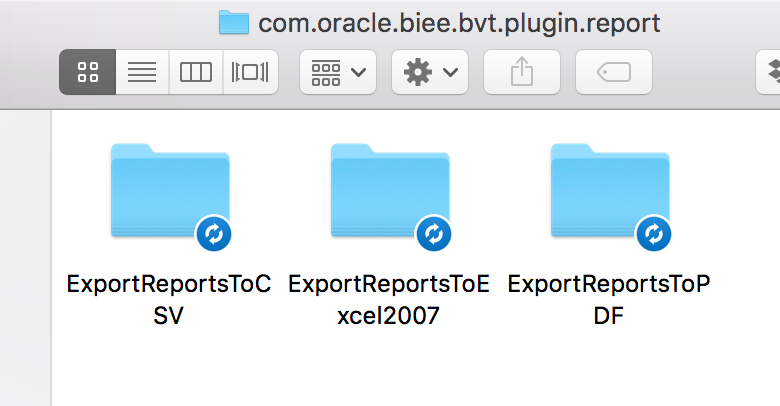
In each of those export folders, you’ll find the export report results. Open the HTML file called ReportPlugin.html.
The sections you’ll find within the Report Plugin test results include:
Report Baseline Verification Passed — The report exports were identical.
Report Baseline Verification Failures — The exports of this report did not match. Reminder in case you have a lot of results in this list: in the config you could consider changing the threshold for decimal place differences on the CSV export. Otherwise, see note below about discovering differences in the report versions.
Report Not Found — The report was found on the first deployment but not on the second.
Reports Failed to Download — BVT was unable to get an export of data from this report. Could be due to the report taking too long to return data (try increasing time limit in config) or the report might be throwing an error.
Unprocessed Reports — BVT was unable to compare the data of these report exports.
New Report Found — This report exists in the second deployment but not in the first.
Failed Report Tests
An improvement was made in the latest version of BVT (Version 18.1.10) which now shows a Failure Reason. While this is helpful, it still requires you manually comparing your report extracts. Also, it seems that the reason is not being displayed for my CSV exports, only Excel and PDF comparisons.


In each of the result sections, you’ll see the same headers:
# — A sequence number for the reports in this section
Name — The name of the report
First Server Link — A hyperlink to the report on the first deployment server
Second Server Link — A hyperlink to the report on the second deployment server
Result — The result of the comparison of the two deployment report exports
First Deployment — A link to the first deployment BVT report export file in the file system. If this link doesn’t take you anywhere, then no report export file exists.
Second Deployment — A link to the second deployment BVT report export file in the file system. If this link doesn’t take you anywhere, then no report export file exists.
UI Test
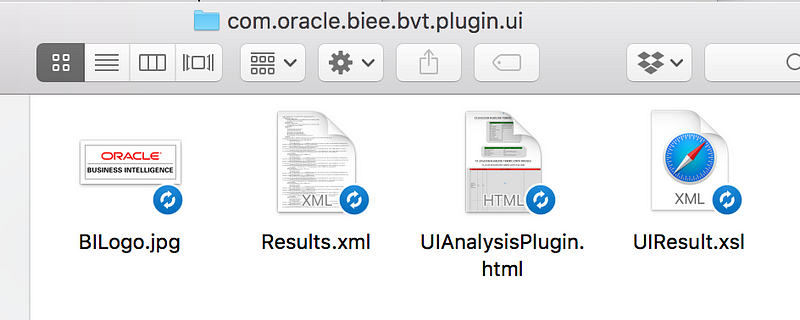
You’ll find the UI test results in the comparison folder then in the folder named with the two deployments that you were comparing (“Dev — Test” in my example). Then in the folder called “com.oracle.obiee.bvt.plugin.ui”, open the HTML file called UIAnalysisPlugin.html.
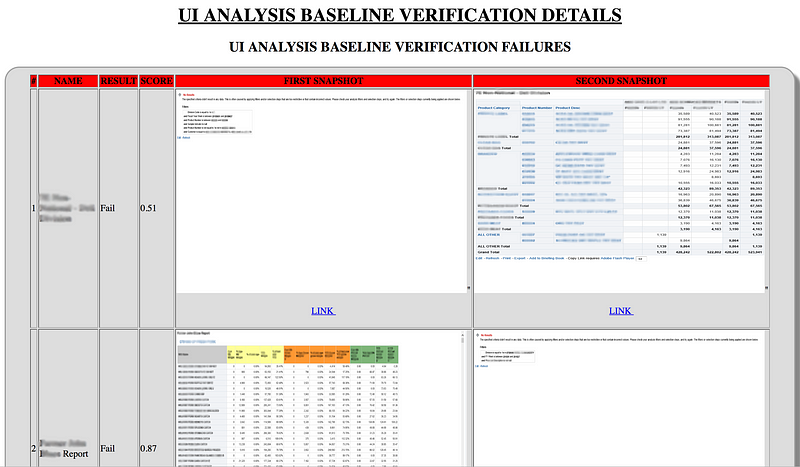
The UI test results HTML page will include the screenshot that BVT captured of each report tested. These are the images that the algorithm scored pixel-by-pixel.
The sections you’ll find within the UI Plugin test results include:
UI Analysis Baseline Verification Passed — The screenshots matched enough to meet the Score Threshold defined in the config.
UI Analysis Baseline Verification Failures — The screenshot exports from this report do not meet the Score Threshold defined in the config.
New Reports — This report exists in the second deployment but not in the first.
Reports Not Found —This report was found in the first deployment but not in the second.
Reports Failed to Compare — BVT was unable to compare the results from this report.
Reports Failed to Download — This report did not render in one or both of the environments. You can see which screenshots were included to see which deployment failed.
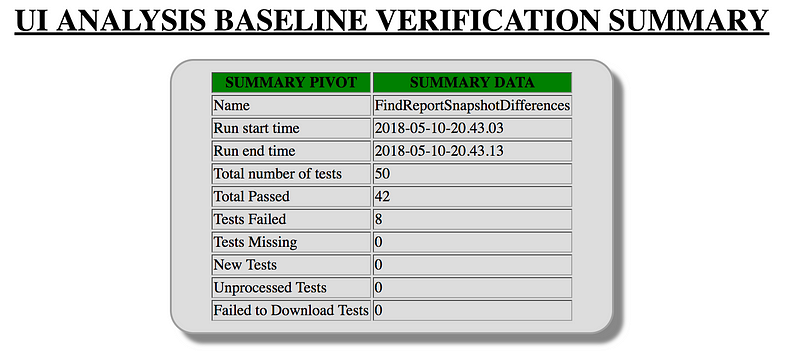
The third column displays the score that this report received. The test for each report will be marked as pass or fail based on the threshold that you defined in the config. The default threshold is 0.95, meaning that the score must be 95% or above to get a passing score. 1.0 is a perfect match.
Under each image is a hyperlink to the file location of each screen capture image file within your Results folder.
Dashboard Test
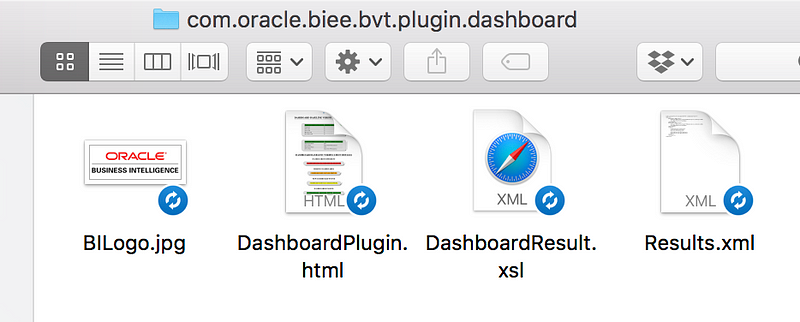
You’ll find the Dashboard test results in the comparison folder then in the folder named with the two deployments that you were comparing (“Dev — Test” in my example). Then in the folder called “com.oracle.obiee.bvt.plugin.dashboard”, open the HTML file called DashboardPlugin.html.
For the dashboard test, I found that if I point the CatalogRoot parameter to the Dashboards folder directly or a folder within it, BVT does not find the dashboards. I had to point the CatalogRoot to the folder containing the Dashboards folder. Another option is to use the ExportDashboardsToXML parameter set to false as I described previously in this series to request that BVT only exports the dashboards in the prompts file.
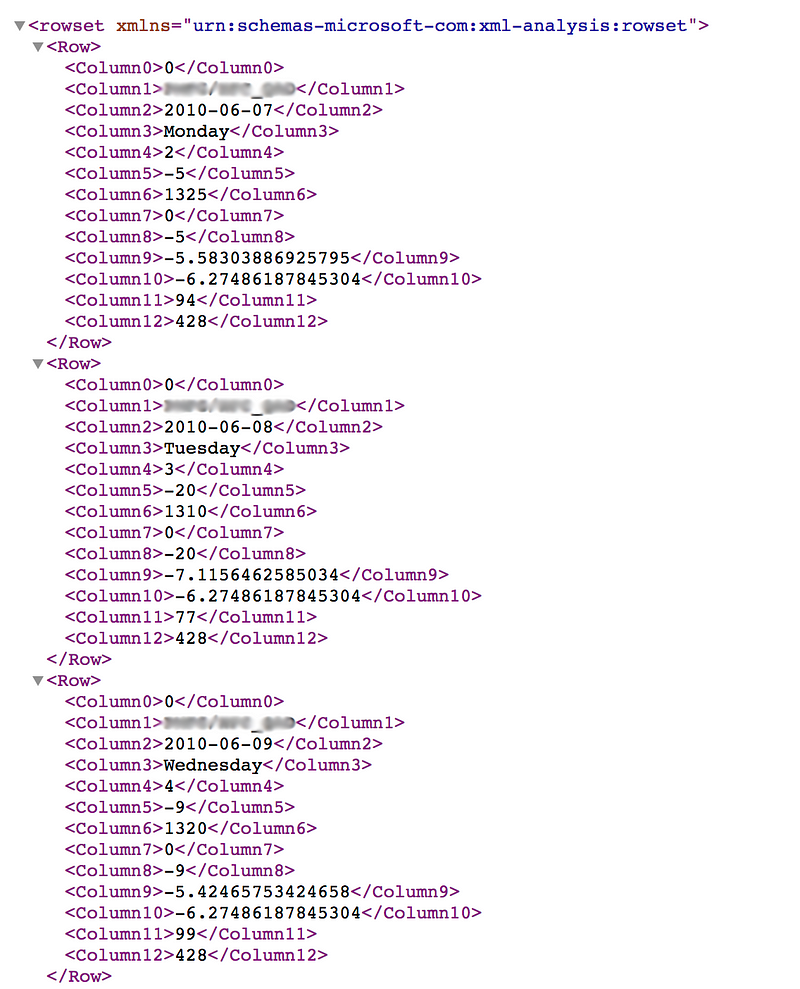
This text exports the xml of the report for comparison. The xml files that it is comparing look like the example below. You can see that it is an export of the data values displayed in the dashboard. Note that the export does not care how the data is displayed in the dashboard such as in a chart. The UI test will test the pixels of the charts. This test compares the data used in the dashboard.
The dashboard test results can be either Fail, Pass, Missing or New Item. Missing means that the dashboard page is in the first deployment but not the second. New Item is the opposite of Missing where it exists in the second deployment but not the first.
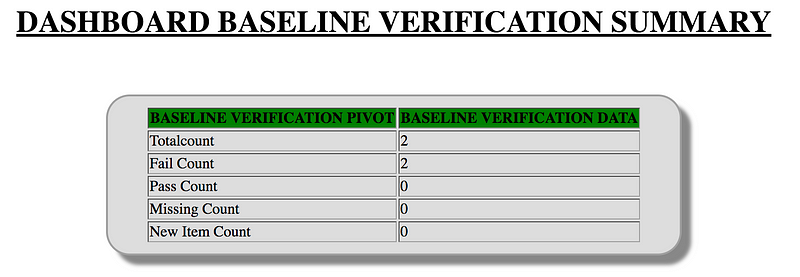
The counts that are displayed in this summary are at a dashboard page level. It’s possible that 4 out of 5 of the reports on one dashboard page passed but if one fails, the page will show up in the failed list.

As you see in the image above, the results do not tell you piece of data was different. To compare these results, I recommend finding the xml output files and comparing similar to how you would with the report test in a file comparison tool. You can use an xml editor, text editor, or Excel to view these xml export files.
BVT Errors I’ve encountered
Single Sign On (SSO)
If you have SSO enabled in your environment, your BVT config file will be slightly different. For the Dashboard, UI and Report tests, you’ll need to use /analytics-ws as the path to your environment in the config. For the Catalog test you will continue to use /analytics.
Throwable: null SEVERE: Unhandled Exception
I came across this error where BVT immediately failed when I tried to run it against a deployment name that didn’t actually exist in my config file. Check your deployment name and run again.
Dashboard test does not export any dashboards
You must set the Catalog Root for the dashboards test at the level of the folder contain the Dashboard folder or use ExportAllDashboards = false and include urls to all of the dashboards to test in your prompts file.
Example:
If I want to test my Usage Tracking dashboards and they are contained in this folder structure (image name Usage Tracking Folder)
The Catalog Root would be set to “/shared/Usage” in this example.