
By Deiby Gómez
In this article, we’ll explore how to quickly detect when Snowflake changes the way it executes your SQL statements. We’ll use the Prismafy tool for Snowflake, which generates detailed reports, allowing you to identify within minutes when a query profile changes. Prismafy is a free, open-source tool that supports external authentication, including user credentials and multi-factor authentication (MFA) for secure connections to Snowflake.
For more detailed information, check out the Prismafy documentation.
What is Prismafy?
Prismafy is an open-source tool developed in Python to analyze metadata for cloud-native data platforms. It provides charts and insights allowing you to quickly detect and resolve problems.
How to Analyze a Specific Query in Prismafy
Three simple steps:
- Download Prismafy: https://github.com/prismafy/prismafy
- Run Prismafy for the specific query: python prismafy.py -d snowflake -t password -a abc.us-east-2.aws -w Prismafy_wh -u Prismafy_user -m 6 -r Prismafy_role –qa your_query_parameterized_hashNOTE: You have to provide the value of “query_parameterized_hash” not the “query_id”.
- Open the “Last Executions Details” report
In the “Last Executions Details” report you will find several useful pieces of information for your SQL Statement, like the following:
- Growth% from the previous execution.
- Query Profile ID (Execution Plan ID)
- Query_type (Which SQL operation)
- User who executed the query
- Time Details
- Row Details
- Byte Details
- Status of the query (Fail or Success)
- SQL Text
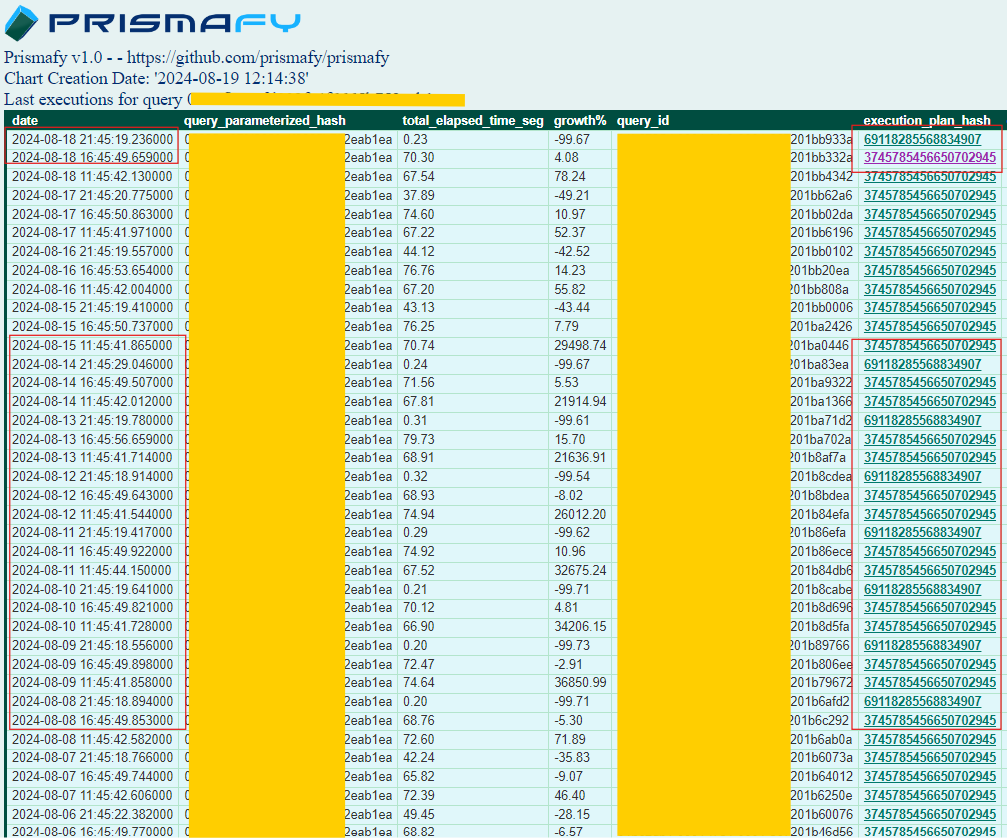
In this report, you can easily detect when a Query Profile changes. You just have to look at the column called “Execution_Plan_Hash” and see when the ID changes. For example, in the following image, you see that the Query Profile ID changed from “3745785456650702945” to “69118285568834907” on “2024-08-18 21:45:19.” By looking at this information, you can quickly identify changes over time.
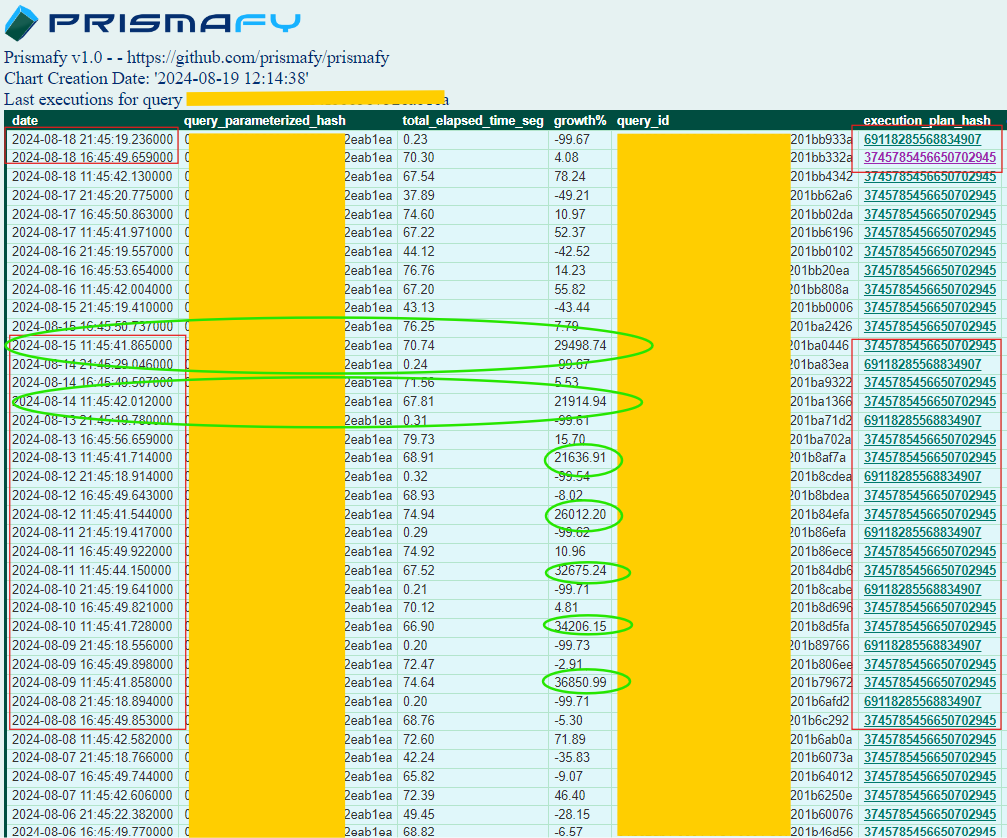
Also, I find the column “growth%” very useful. Here, you can identify how much your query has grown in percentage since the previous execution. For example, in the following image you can see that on “2024-08-15 11:45:41” the query grew around 29498.74%. This means it was being executed with 0.24 seconds in the previous execution, and then it was executed in 70.74 seconds.
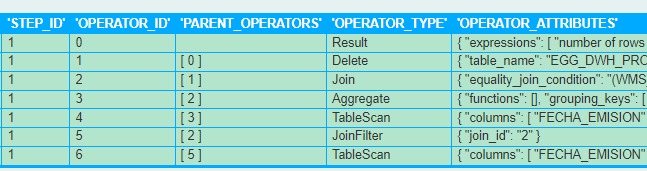
If you select any “Query Profile ID (Execution Plan Hash)”, you can view all the details. For example, in the following image, you can observe the order of steps that Snowflake performs to execute your query:
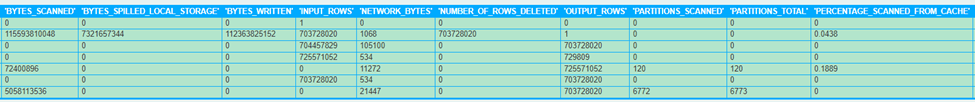
Prismafy presents a lot of stats info, so that you can measure which step is the most dangerous in your Query Profile, among them:
- bytes_scanned
- bytes_spilled_local_storage
- bytes_written
- input_rows
- network_bytes
- number_of_rows_deleted
- output_rows
- partitions_scanned
- partitions_total
- percentage_scanned_from_cache
- scan_progress
- local_disk_io
- network_communication
- overall_percentage
- processing
- remote_disk_io
- synchronization
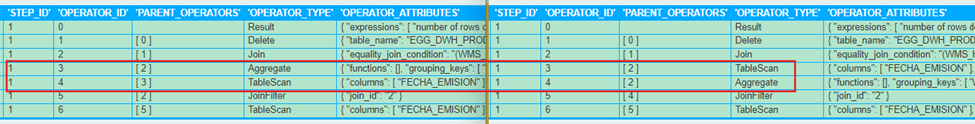
You can easily detect in which specific step of the Query Profile there is a change. For example, in the following image, we can see that in the Step [2] of the Left Query Profile there is an “Aggregate” operation, while in the right Query Profile there is a “Table Scan.” The order changed and while it’s not expected to cause a bad performance, this can happen from time to time.
Note: For a better view, click images to enlarge.
Next up: How to know which users and roles have ACCOUNTADMIN role in Snowflake
For more Snowflake insights, check out our Snowflake-related blogs or visit the Snowflake Developer Resources.
Deiby Gómez was the first Oracle ACE Director of Guatemala (2015-2023), holding 35 Technology certifications among them the highest certifications for Oracle Database (Oracle Certified Master, OCM) and 3 Advanced Snowflake Certifications (Architect, Administrator and Data Engineer). Deiby is an engineer with 2 master’s degrees and a future lawyer. Deiby has spoken at Technology Events in more than 12 countries including Oracle Open World in San Francisco, USA. He is the Technical Reviewer of the book Oracle Database 12cR2 Multitenant – Oracle Press and co-author of the book Oracle Database 12cR2 Testing Tools and Techniques for Performance and Scalability – Oracle Press.