
This is a topic that I was teaching about last night in my Digital Analytics class at the University of Utah and instead of only sharing what I found with my students, I thought I’d share here in the blogosphere.
What I’ve found was yes it’s easy to pull Twitter posts into R for analysis! However, it only pulls one week of day (between 6–8 days actually) so if you want trending or historical data, you’d have to save this data somewhere. The exception to this is if you subscribe to the Twitter Firehose which will give you a firehose of historical data (see what I did there?).
Also, I’ll note that I’m running R on my mac and with the data I used I didn’t have performance issues however if you have a large dataset keep in mind that R is a memory hog.
Instructions:
First, you need authentication tokens to access the Twitter API. Follow instructions here: https://dev.twitter.com/oauth/overview/application-owner-access-tokens. You will need a twitter account to be able to setup an application in Twitter.
Now go into RStudio.
#Install and load twitteR package
install.packages("twitteR")
library(twitteR)
#Get the following keys & tokens from that twitter link above once you register an application. api_key = "<add api_key here>" api_secret = "<add api_secret here>" access_token = "<add access_token here>" access_token_secret = "<add access_token_secret here>"
#Setup Oauth for Twitter
setup_twitter_oauth(api_key,api_secret,access_token,access_token_secret)
#Get tweets and save as a value in environment
#Can search for usernames, hashtags, or general terms
tweets = searchTwitter('<Search term>', n=<number of tweets to pull>, lang='en')
#I wanted this data in a data frame to be able to draw graphs on it
saveRDS(tweets, '<path>/My_Tweets.RDS')
tw = readRDS('<path>/My_Tweets.RDS')
tweetDF = twListToDF(tw)#Find Top 10 Favorited Tweets. I used the data.table package for doing this.
install.packages("data.table")
library(data.table)
tweetDT <- data.table(tweetDF, key="favoriteCount")
tweetDT <- tweetDT[order(favoriteCount),]
topFavorites = tail(tweetDT, 10)
View(topFavorites)#Start Visualizing
install.packages("ggplot2")
library(ggplot2)#How many favorites did we have on this hashtag? ggplot(d, aes(x=created, y=favoriteCount)) + geom_smooth()
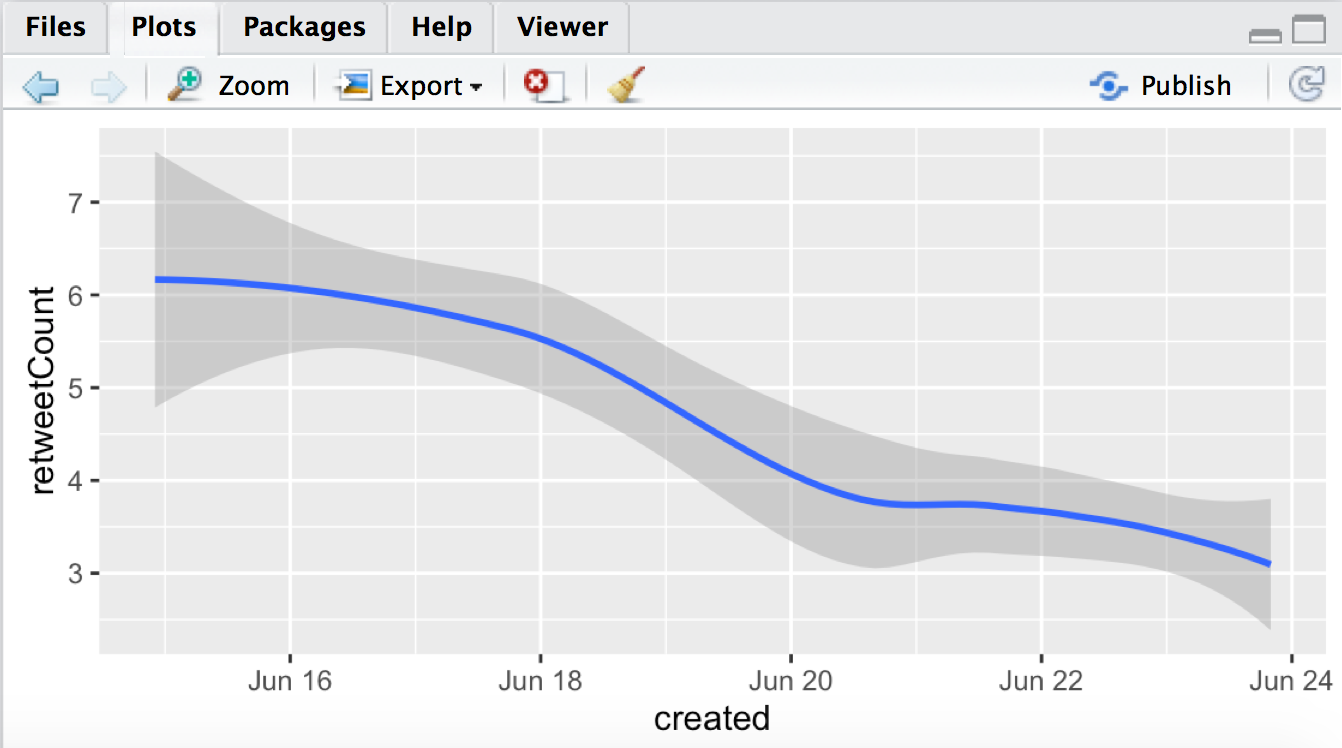
#How many retweets?
ggplot(d, aes(x=created, y=retweetCount)) + geom_smooth()
I was surprised how easily I was able to pull this data and start working with it. I love R more and more every day!
Thank you for reading this Red Pill Analytics’ blog post. You can find more blogs by our amazing authors here. Check out more info about Red Pill Analytics at redpillanalytics.com.