
How to easily get metrics per dbt Model in Snowflake
DBT is one of the most popular solutions to write and execute dynamic SQL Statements. It’s quick and easy to convert complex SQL statements into a few lines of code in DBT, we have the flexibility to use different configurations to customize our models, we can use Jinja and Macros, to schedule jobs in DBT Cloud, among other benefits. The core of DBT is a Model. Models are .sql files with a SELECT clause that materialize data in your target database and you can materialize your model into a table, view, as incremental or ephemeral.
However, most developers are focused only on writing code and building the model in order to materialize the transformed data in the target database. As a developer, we are complying with the requirements, but also it’s so important to consider the impact of our code in the target database because that can cause other problems for your customers. I will share a simple and easy tip that you can use in your day-to-day work that will allow you to get metrics in Snowflake per DBT model that you are writing, or you can use this tip to any other use case where you want to send further information to Snowflake from any other tool, not necessary DBT. In this article, we’ll apply the tip to detect those DBT models that are spending a lot of time to be executed and determine if they are having poor performance impacting others models.
I can identify the following impacts of our models in a Snowflake account:
- Increasing the bill: In Snowflake, the bill is mostly built by the time a warehouse is active. There are other factors also contributing to the bill such as storage, cache, etc but I would say that the processing time is the most important factor. It’s very important to detect those SQL statements that are taking too much time to complete.
- Poor Performance: If our DBT model’s SQL is not optimized, those models will take more time to complete. Or if you have models that are overloaded in logic they will also take more time to complete. Problematic models will not only spend several credits in your Snowflake account, it can also cause more SQL statements to get pushed to a queue and wait, which also increases the time a Snowflake warehouse is active.
- Complexity in the Performance Troubleshooting: Whenever a SQL Statement is detected as problematic in Snowflake, the Snowflake Administrator has to understand the logic inside the SQL Statement and determine where the problem is in order to provide tuning recommendations. If the code in the DBT model is too complex, that would make the performance issues difficult to troubleshoot. One of the best practices is to build DBT models with smaller, reusable pieces of code. Avoid duplicating code and creating models with overloaded logic.
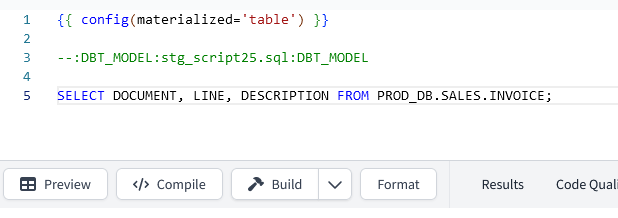
DBT compiles the code that we write into the DBT model and executes the resulting SQL statements into Snowflake. So it’s difficult to know the execution metrics of each DBT Model in Snowflake without having additional information to detect which SQL statements are DBT Models. Some people filter the SQL statements in Snowflake by the SQL Text, but every model has different SQL Text. So a simple tip we can use is to incorporate the model name in the middle of two tokens as a SQL comment. That way we are not changing anything in the SQL Statement Logic, but we are sending further information to Snowflake and we are helping the Snowflake Administrators in their day to day work as well. Once we have that DBT Model as further information in Snowflake, we are ready to filter those SQL statements and start the analysis. In the following image I am sharing an example, I am using the token “:DBT_MODEL:” to mark the beginning and the end of the DBT model name. This way you can incorporate in the name even folder names like “models/folder1/folder2/stg_script.sql”.
This can be improved if you use a dedicated Snowflake warehouse to execute only your DBT Models. For example, in this article I am using the warehouse called “DBT_PROD_WH”, and that warehouse is dedicated only to DBT. This will make the analysis easier on how many credits are being spent by your DBT Models.
Once that SQL Comment is included in the DBT Model, we can filter all the SQL statements related to DBT. We can use the Snowflake function “regexp_substr” to extract the DBT model name and then get any metric we want to analyze. For example, In the following query I am extracting metrics that will allow me to see if my models are being queued, if we have a leak of memory in the warehouse (spilling bytes to local or remote storage), among others. You can explore more metrics in the table snowflake.account_usage.query_history.
SELECT
        regexp_substr(query_text,
':DBT_MODEL:.*:DBT_MODEL', 1) query_text,
        count(*) EXECS,
        round(sum(TOTAL_ELAPSED_TIME)/1000,0) TOTAL_ELAPSED_TIME_SECS,
        round(sum(TOTAL_ELAPSED_TIME/1000)/count(*)) AVG_ELAP_PER_EXEC,
        round(sum(BYTES_SPILLED_TO_LOCAL_STORAGE)/1024/1024/1024,2)
GB_SPILLED_TO_LOCAL_STORAGE,
        round(sum(BYTES_SPILLED_TO_REMOTE_STORAGE)/1024/1024/1024,2)
GB_SPILLED_TO_REMOTE_STORAGE,
        round(sum(QUEUED_OVERLOAD_TIME)/1000,0) QUEUED_OVERLOAD_TIME_SECS
FROM snowflake.account_usage.query_history
WHERE query_text LIKE '%:DBT_MODEL:%'
and warehouse_name='DBT_PROD_DW'
GROUP BY regexp_substr(query_text, ':DBT_MODEL:.*:DBT_MODEL', 1)
ORDER BY TOTAL_ELAPSED_TIME_SECS DESC;
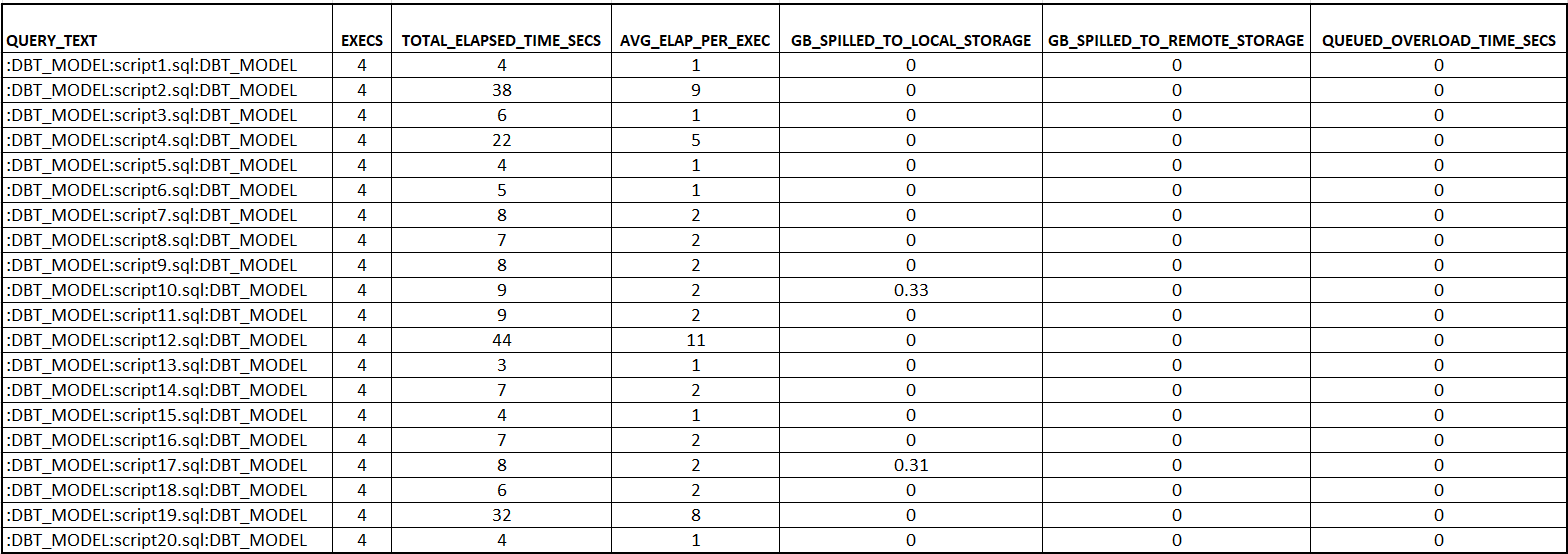
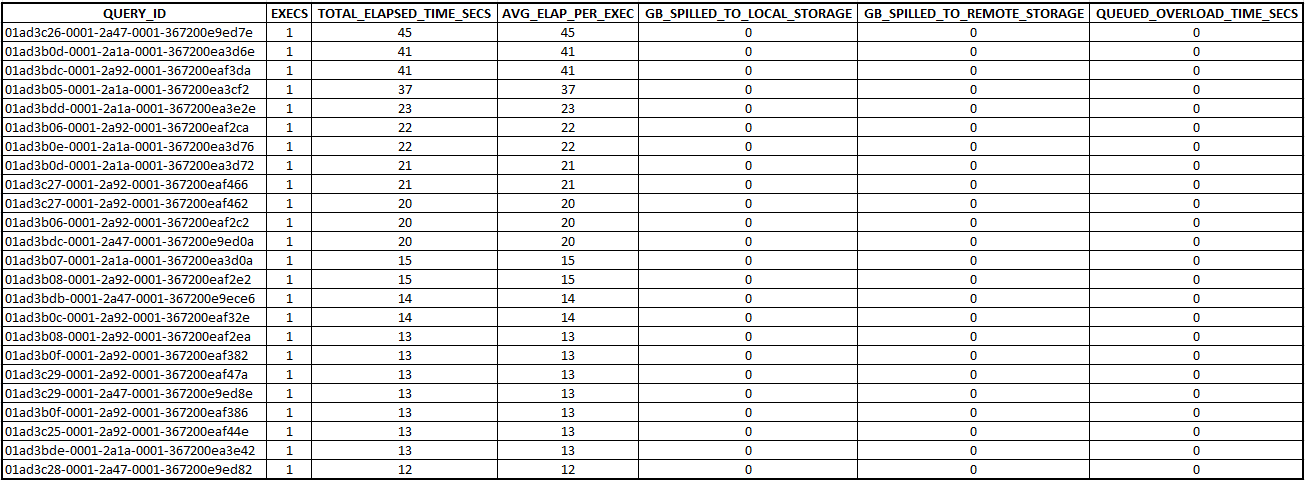
It’s extremely important to aggregate the metrics by our the DBT Model name and not by the column “QUERY_ID” because if we use the column QUERY_ID in snowflake.account_usage.query_history, we will not aggregate correctly the data since Snowflake assigns an unique QUERY_ID to each SQL Statement, no matter if the SQL Text is the same. You can confirm this in the following image, Where I am using the column QUERY_ID to aggregate the metrics, we see unique executions.
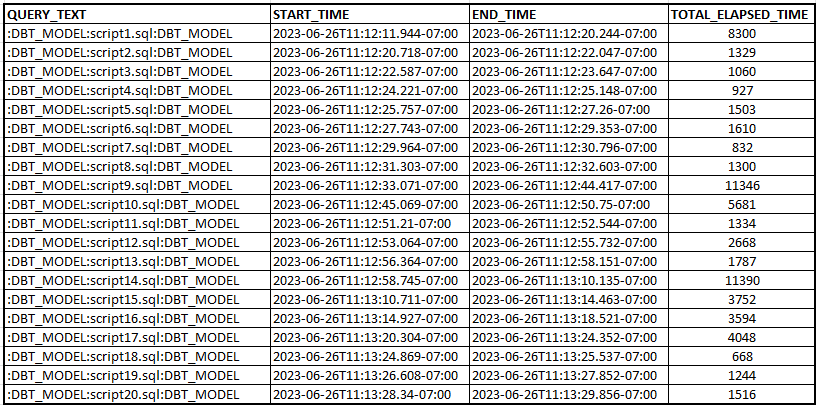
If you want to understand how your DBT models are impacting your Snowflake Costs, you can take a look into the table snowflake.account_usage.query_history and also the table snowflake.account_usage.warehouse_metering_history, not only the total elapsed time per DBT Model is important. Snowflake charges for the processing time used by each warehouse, and also charges for the warehouse size, if you are using clusters, etc. Remember, depending on the size of the warehouse and whether you are using clusters or not, Snowflake can process SQL statements in parallel, that’s why you don’t have to take a look only on the total elapsed, because in a period, several SQL statements can be executed, instead of that, we have to be focus on how much time the warehouse was active.
SELECT
    regexp_substr(query_text, ':DBT_MODEL:.*:DBT_MODEL', 1) query_text,
    START_TIME,
    END_TIME,
    TOTAL_ELAPSED_TIME
FROM snowflake.account_usage.query_history
WHERE query_text LIKE '%:DBT_MODEL:%'
    and warehouse_name='DBT_PROD_DW'
ORDER BY START_TIME;
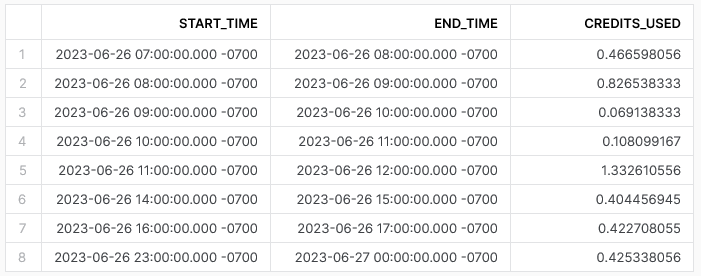
And you can use the table snowflake.account_usage.warehouse_metering_history in order to make a correlation between the spent snowflake credits and the SQL statements.
SELECT		start_time,
                end_time,
                credits_used
FROM snowflake.account_usage.warehouse_metering_history
WHERE warehouse_name='DBT_PROD_WH'
ORDER BY start_time
If you are looking for a more robust solution to measure how many Snowflake credits your dbt models are spending, or you want to investigate more performance factors of your DBT Models in Snowflake, you can use one of the following two solutions:
- snowflake_spend package: This package was created by GitLab Data Team. According to the readme file this is a dbt package for understanding the cost your Snowflake Data Warehouse is accruing.
- dbt-snowflake-monitoring package: This package was created by SELECT Team (get-select). According to the readme file dbt-snowflake-monitoring package is totally free and open-source. It monitors both Snowflake and dbt performance and costs. The package can be used to:
- Understand Snowflake costs over time across a variety of useful dimensions (service, warehouse, database, etc.).
Attribute costs within a warehouse to different users or query workloads using our cost-per-query algorithm. - Identify unused tables and their associated storage costs.
Tag all dbt issued queries with rich metadata, enabling you to understand dbt resource costs and performance over time.
- Understand Snowflake costs over time across a variety of useful dimensions (service, warehouse, database, etc.).
Is your organization adapting to remain competitive? In The Architect Room, we design a roadmap for the future of your digital organization, while capitalizing on current technology investments. Our knowledge spans a variety of offerings across all of the major public cloud providers.
32 Responses to How to easily get metrics per dbt Model in Snowflake