
Some tips, tricks and thoughts on using Google Data Studio
Red Pill Analytics recently delivered a solution that exclusively used Google Cloud Platform. Our client, a marketing team at Google, wanted to know how they were engaging with users across several online channels. We used Google Analytics, YouTube Analytics, AdWords, among other sources via BigQuery to bring data into Data Studio. For those of you not aware, Data Studio is Google’s cloud data visualization offering. (You can read more about what Google has to say about it here).
Are You Connected?
Data Studio has a large number of native connectors that will allow you to connect to data in sources such as Google Analytics, YouTube Analytics, BigQuery, MySQL, and Google Sheets to name a few. A criticism I first had about Data Studio was the inability to join data sources within the application. Simply put, if you want to import several sources into Data Studio and use them in one visualization, you will have to combine them elsewhere. For several of our data sources, this was no big deal. In fact, Google Analytics data in particular works flawlessly with the Google Analytics native connector found in Data Studio. However, we had several sources that didn’t have quite the level of detail we needed in the native connector. This led us to use Data Transfer Service, which is a utility in BigQuery that will transfer data from Google owned and operated services. Hard to think of where they came up with the name, right? (More on that later).
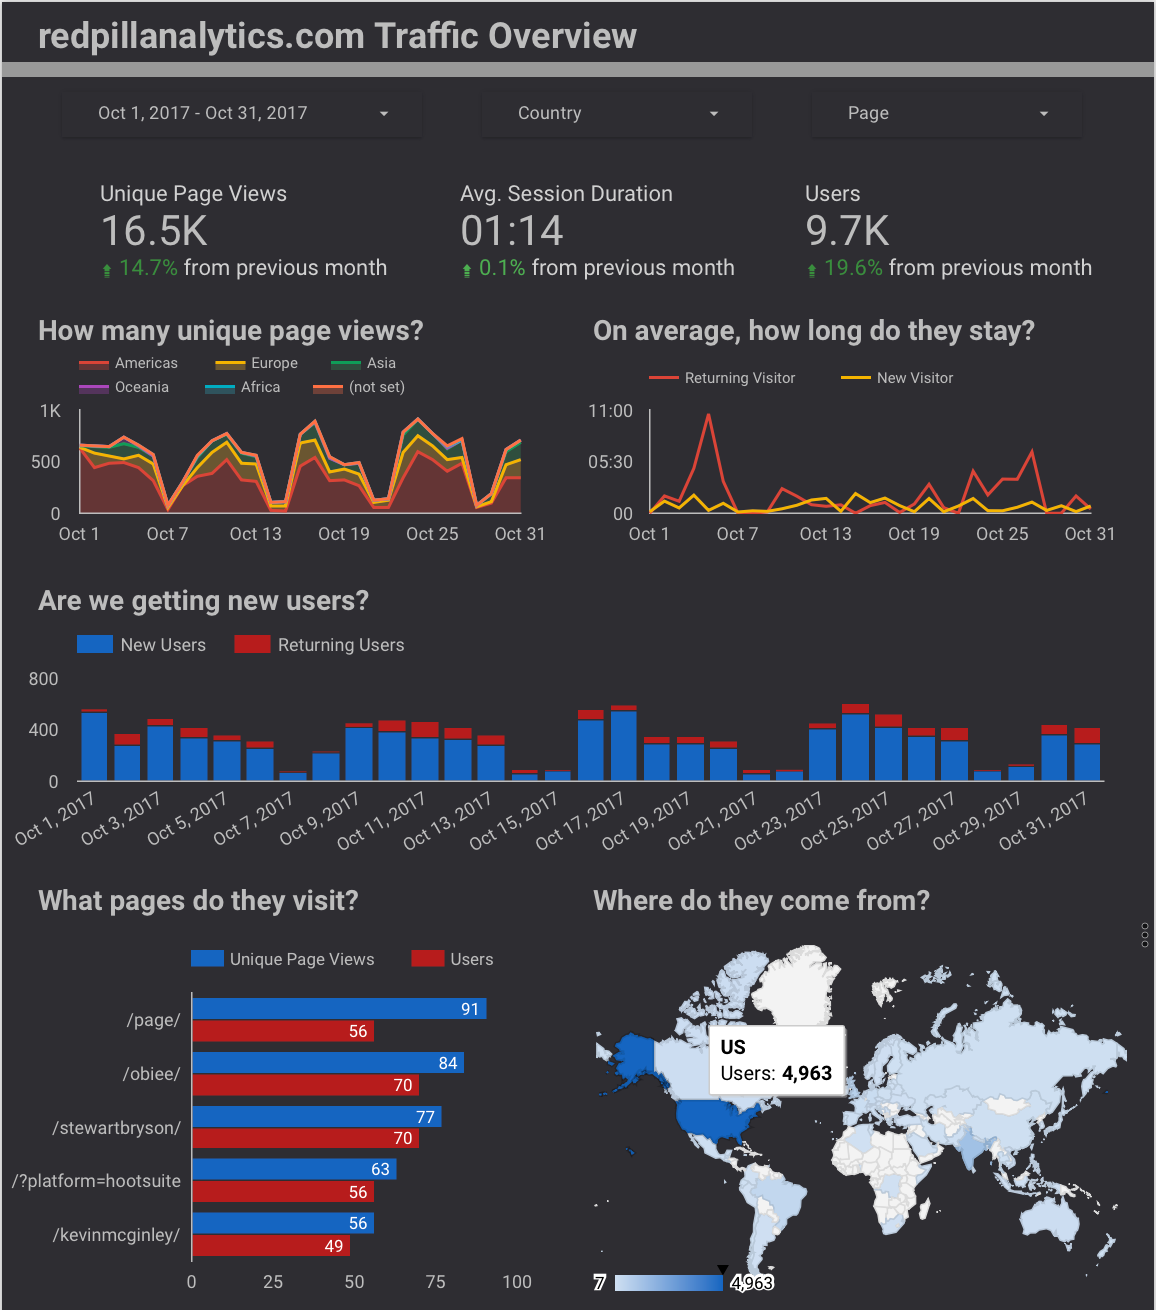
The Data Studio page to the left are similar to the pages we delivered at Gooogle, and were created with the Google Analytics connector in Data Studio using data collected on redpillanalytics.com. Want to take a guess as to how much customization to the data source was needed to produce that report? 1 column. I created the “Returning Users” column logically from other available columns brought in by Google Analytics. We did similar pages for other data sets for Google, with minimal logical customization needed. Yes, some of the connectors to the Google products and data sets behind them really are that good.
Plug-n-Play? Not Quite
There are quite a few connectors available for Data Studio that natively connect to data sources. But how about if you have data that isn’t coming from one of those? Data Studio has the ability to bring in data from Google Sheets or more importantly, BigQuery. (For those of you unfamiliar with BigQuery you can read more here.) We were able to get our hands on BigQuery’s Data Transfer Service, which allowed us to load data into a Google Cloud Project from several sources (Firebase, YouTube and AdWords to name a few).
When it came time to create visualizations on those data sets in BigQuery, we initially found that it was difficult to create visuals that told a coherent story, were filterable on the same prompts, and felt part of a cohesive whole. This is because Data Studio does not support joins between data sources (as I said before). This was somewhat surprising as there are other popular data visualization tools that allow this functionality. But I digress…
Being the resourceful guy that I am, I rolled up my sleeves, brushed off my SQL skills and started creating database, er, BigQuery views to handle the more complex logic that Data Studio couldn’t. Once the views were written, it was easy to connect Data Studio to them with the BigQuery connector and create visualizations.
Asking the Right Questions
Another thing that is notable about Data Studio is its pixel perfect nature. The ability to place anything anywhere on the canvas is so refreshing. Compared to preformatted, designated areas for reports and prompts, Data Studio exhibits a sense of freedom not usually experienced in data viz, BI or analytics tools.
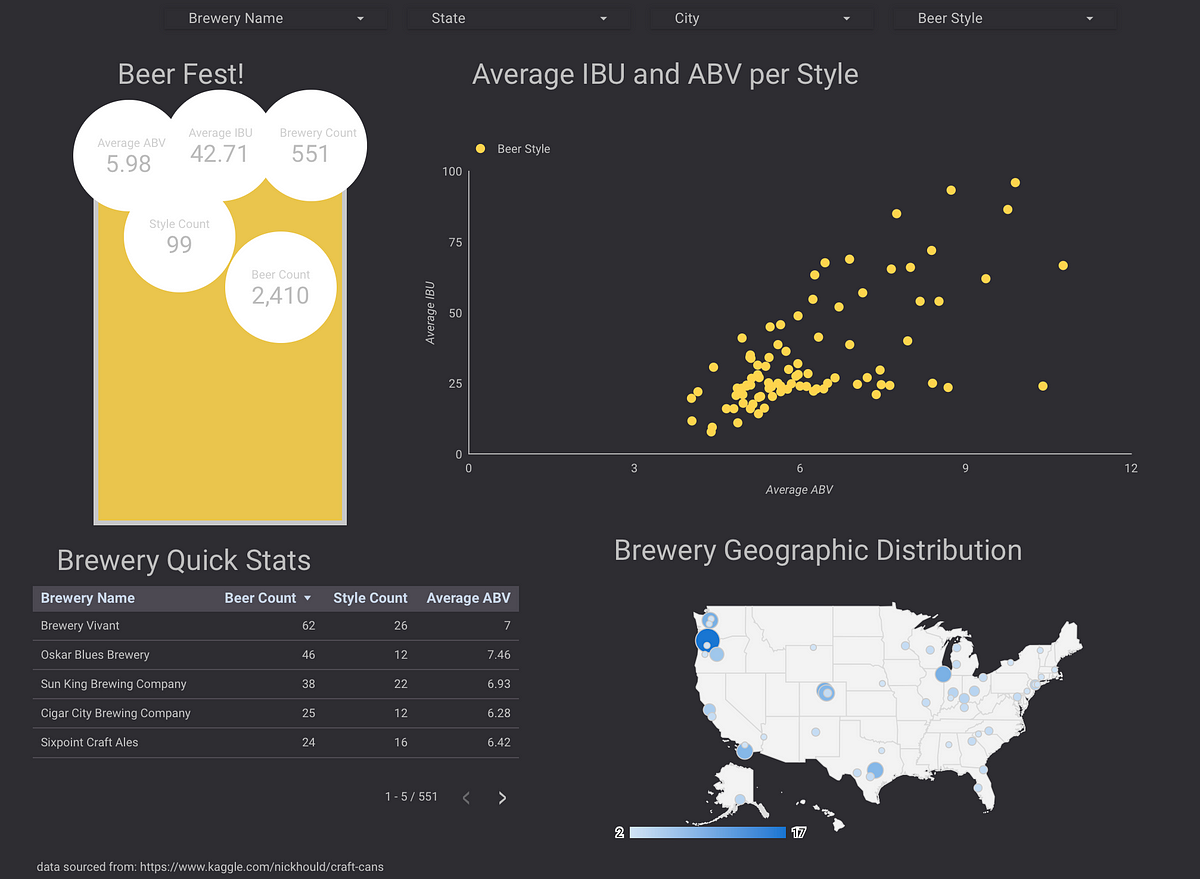
Like any new found freedom, it can be hard to know what to do, and we often start causing trouble because we don’t know any better. To the left is what happens when you try to port the old world into the new one.
While the dashboard I created isn’t terrible, it doesn’t play to the strengths of the tool. And this is because of an old world mentality. The use of simple (and not helpful) titles, relying on the user to “figure it out” and overall, the lack of a story. These were common dashboard and reporting mistakes made with enterprise tools like OBIEE. Data Studio restricts the ability to make those mistakes with the freedom to structure as you see fit. And this freedom means that we need to ask questions. (Check out my blog for more thoughts on that topic.)
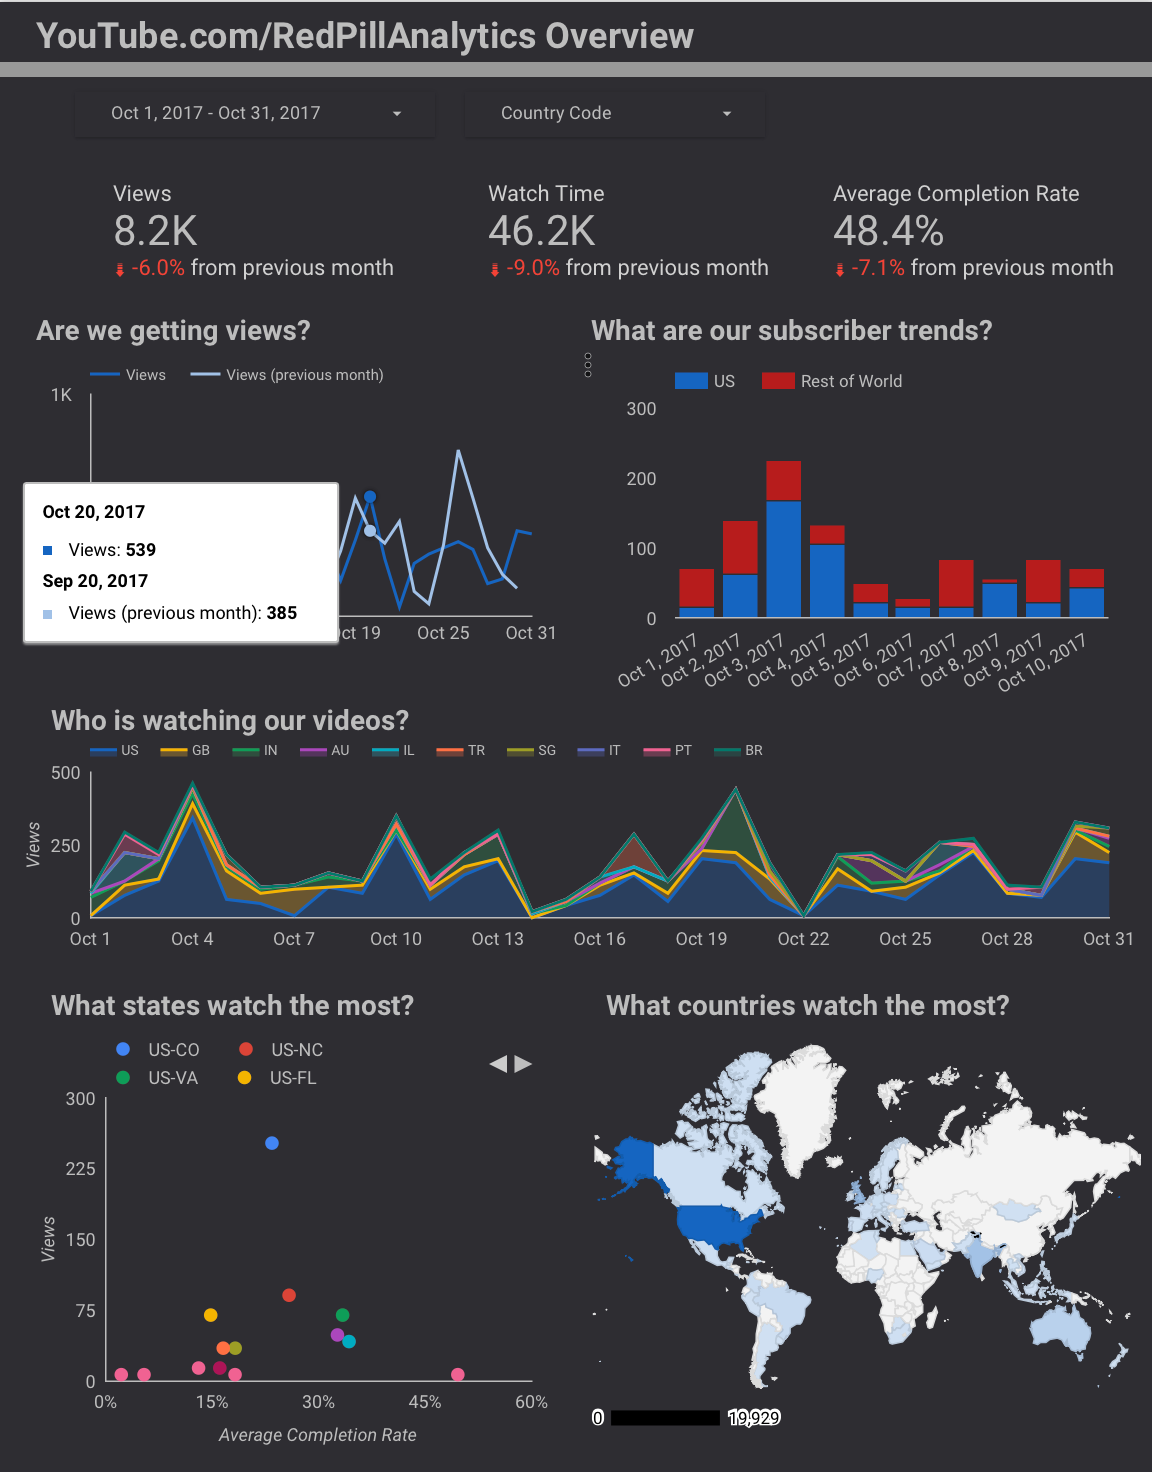
Let’s contrast my craft brewery report with the one to the left, which is an overview of Red Pill’s YouTube performance. Let’s start at the top and work our way down.
We can see some filter controls at the top: one for the date range, and one for the country code. I’ve worked at clients where there have been over 20 prompts on a dashboard. If you need so many filter controls, you don’t know what questions you’re asking.
Moving down a level, we can see we have some scorecards, which introduce the consumer to what we are talking about. Scorecards such as these can help set the tone and a frame of reference for more detailed visualizations. Additionally, the trending for these scorecards is as simple as defining the period of time we wanted to trend for. Defaults include last period (whatever the equivalent amount of time is selected for the report) or last year, but there are ways to customize as well. Think about how hard that would be in most other tools!
Finally, we get into the guts of the report page. You’ll notice that each visualization answers a question. You’ll also notice that we don’t have any tables in the report. While tables are fantastic for doing detailed analysis, being used as seed data for machine learning or statistical analysis, they look and act terribly on dashboards. Focusing our attention to answering questions and getting answers gives us a better output, and utilizes the tool as it should be.
The Silent Cartographer
Data Studio loves mapping data. Not only does it love it, it is good at it. Gone are the days of creating tedious map layers, curating geo data types and ensuring that lat-long values are correct. All that is required in Data Studio is setting data types correctly, which is incredibly simple.
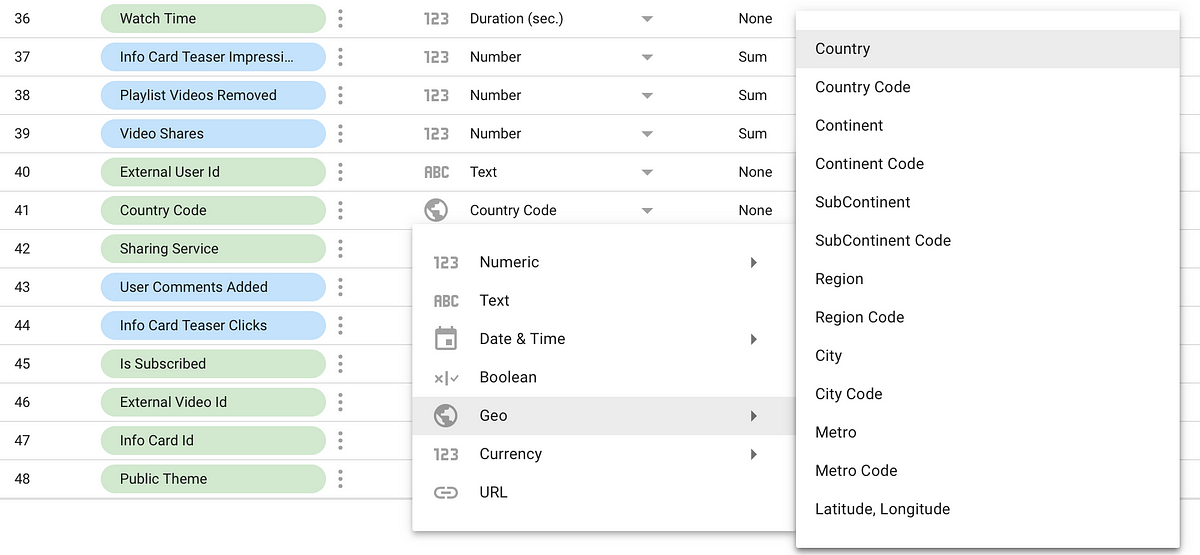
You can see to the left is the drop down menu used for setting the geography type. Set the data type to the corresponding value set, and away you go! I’ve found that the code values correlate to geo ISO codes, and non-code values are names. The example to the left is from YouTube Analytics example we saw above.
Sharing is Caring
Another notable feature about Data Studio is its integration with Google Drive. This allows for easy sharing and collaboration with others. There are several options once you share, which will permit users to view, edit or become owners of the report. These permissions will also be inherited if the report is moved to a different folder; the users that have access to that folder will also have those permissions. Gone are the days of guessing which security groups a person is in or if that group has access to the report, because with Google Drive, it is pretty darn easy to know who has access to what.
One other thing to note is that data connectors are also stored in Google Drive, rather than being stored within the report. (However when a data connector is created, it is saved into the creator’s Google Drive home.) This means that the data connectors could be edited by multiple people and used within multiple reports. The same type of permission logic I talked about above is present here allowing for edits to be made by those with access to a Drive folder. Though it is worth noting that there is another level of nuance here. Data can be secured by setting a data source to query as the user (the default is to query as the owner) allowing for data level security to be implemented.
Four Stars and Two Thumbs Up
There is definitely some nuance that accompanies more complex data in Data Studio, but that is to be expected with any tool. Safe to say, I think that Data Studio is abound with awesome features, and I would be happy to use it with clients again.