Dynamic Looker Visualization based on Dimensional Hierarchies
Here we have created a Dynamic Visualization based on the Dimensional Hierarchies of Country -> State -> City. When Country is selected in the Filter, the Visualization shows the States for the specified Country. When State is selected in the Filter, the Visualization shows the Cities for the specified State.
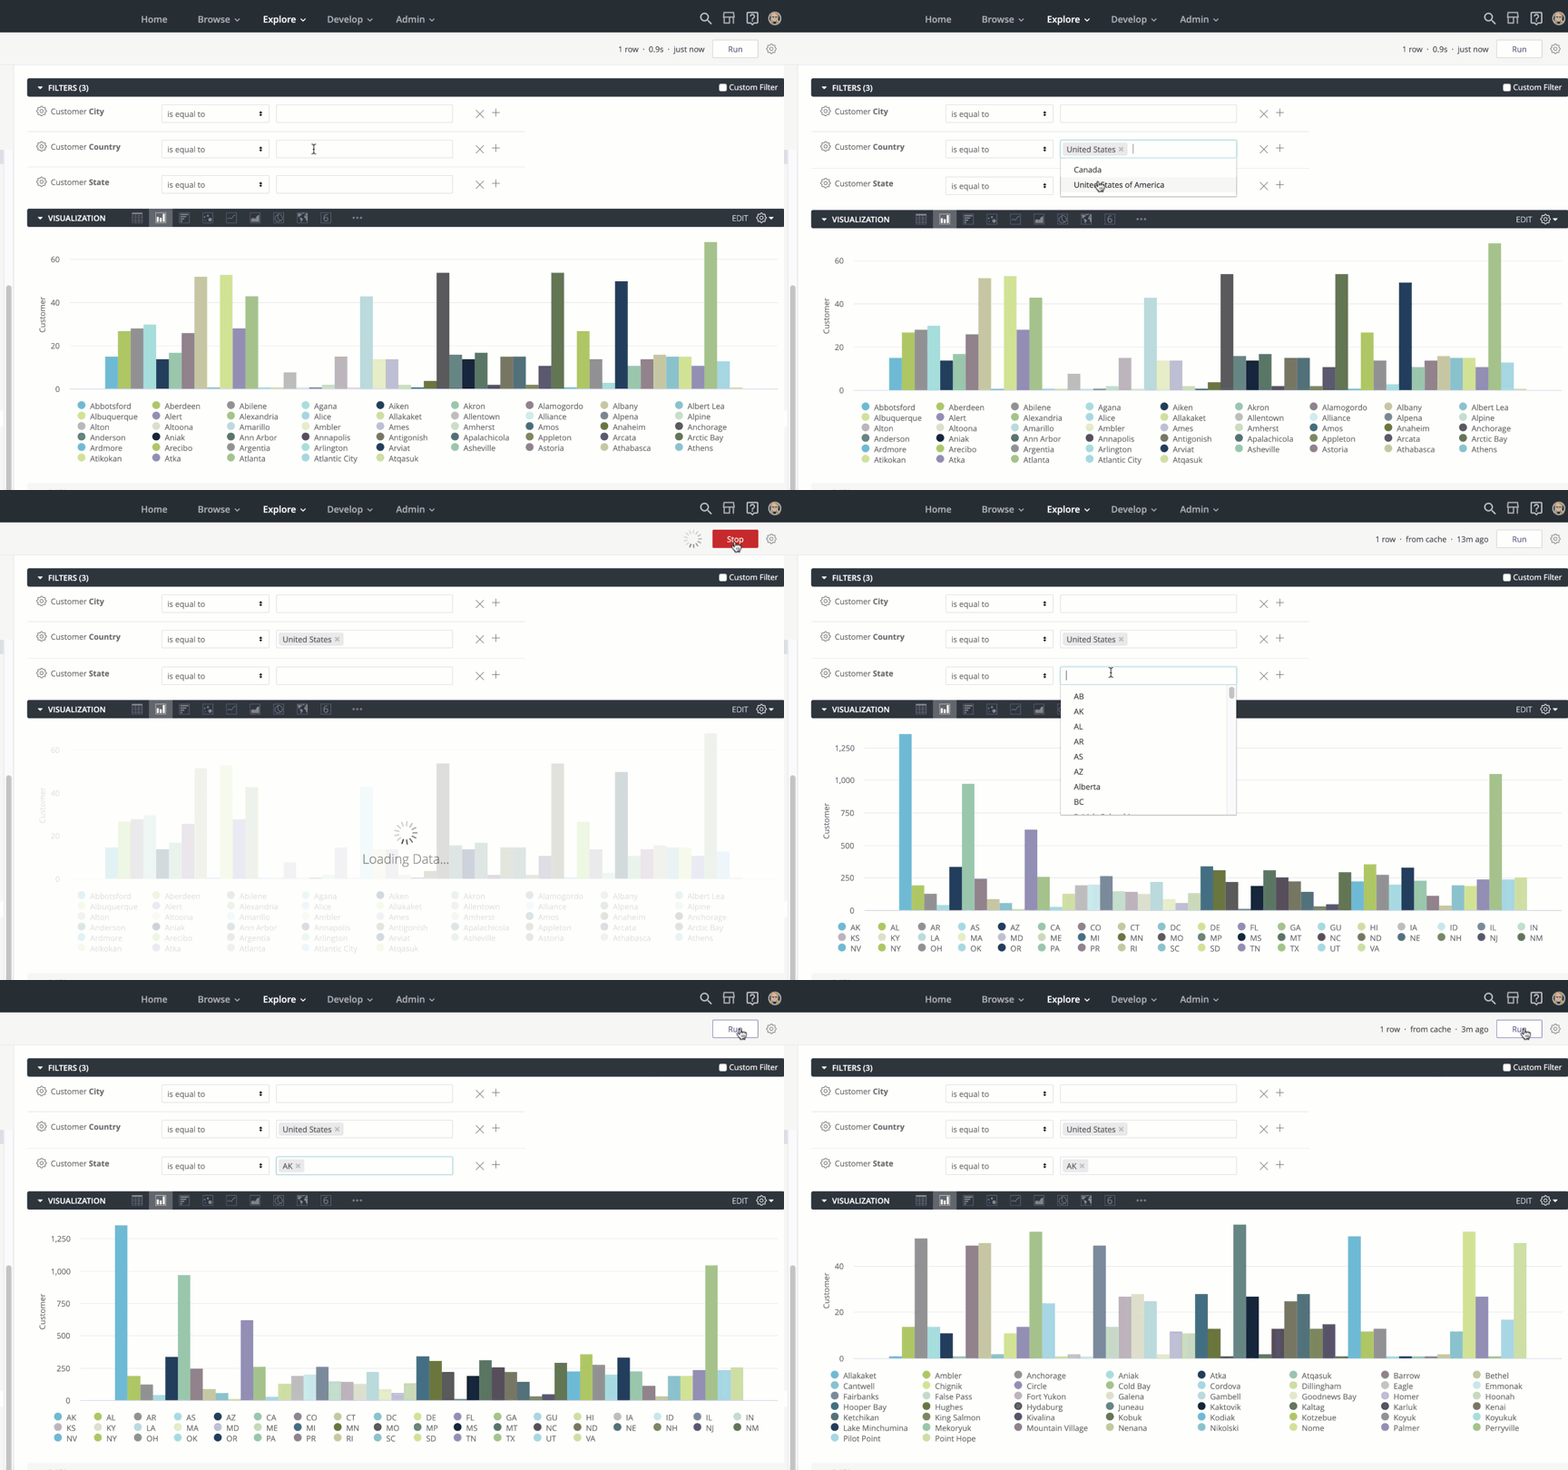
Here is how it works. Within the view, we created a custom dimension named selected_hierarchy_dimension. Here is the LookML code:
dimension: selected_hierarchy_dimension {
    type: string
    sql:{% if state._in_query IS NOT NULL %}
         ${city}
        {% elsif country._in_query IS NOT NULL %}
          ${state}
        {% else %}
          ${country}
        {% endif %};;
}
We are using a simple If statement to define our selected_hierarchy_dimension dimension using Liquid Variables. Liquid templating can be used to create dynamic content. In the selected_hierarchy_dimension we are using the if, else if, elsestructure in conjunction with _in_query Liquid Variable. The _in_query variable returns true if the field defined is used in the query. More about Liquid Variables can be found here: https://docs.looker.com/reference/liquid-variables.
Remember when using an If statement, once the condition is evaluated as true it will return the specified value. The order of the If statement is important, otherwise it may not give you the expected output. In the example above we start with the lower level of the Hierarchy, the State.
- If the State Dimension is in the query and NOT NULL, it will return the City Dimension.
- If the Country Dimension is in the query and NOT NULL, it will return the State Dimension.
- If nothing is selected, it will return the Country Dimension.
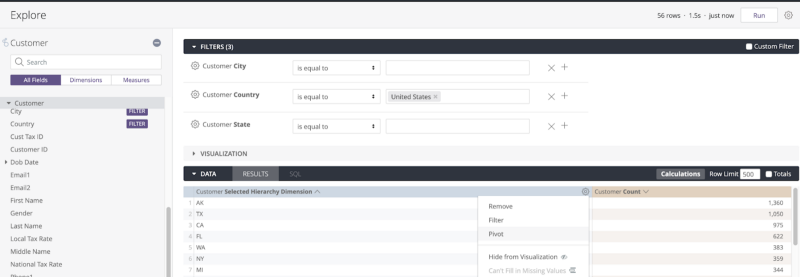
Using the newly created dimension: selected_hierarchy_dimension and the Country, State, and City dimensions as Filters in the Look; we can create a dynamically changing visualization.
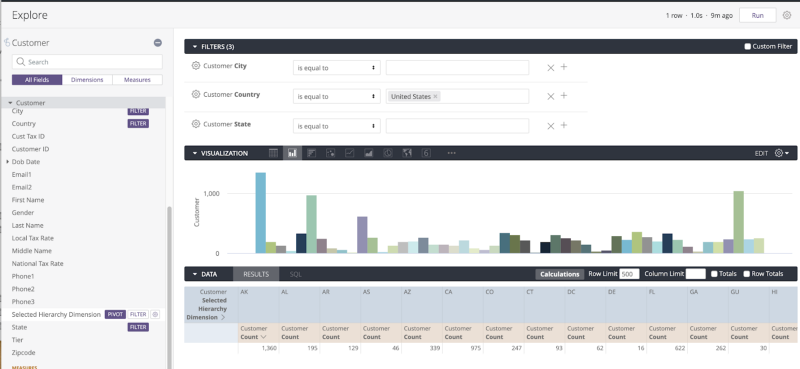
By pivoting the data, we can see the dimension as a column instead of a row. This allows us to better consume, summarize, analyze, and present the data in a visualization.
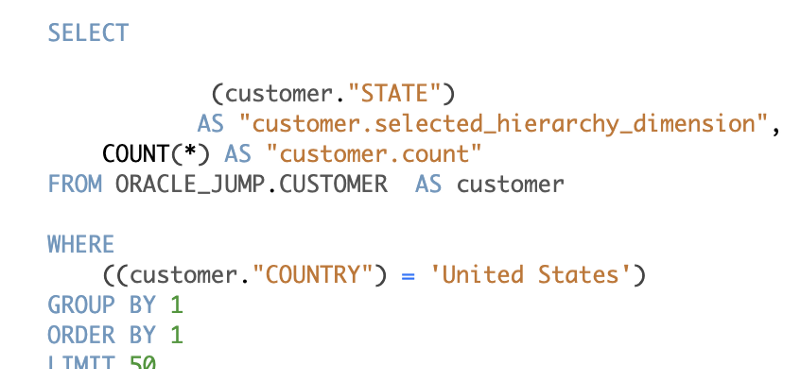
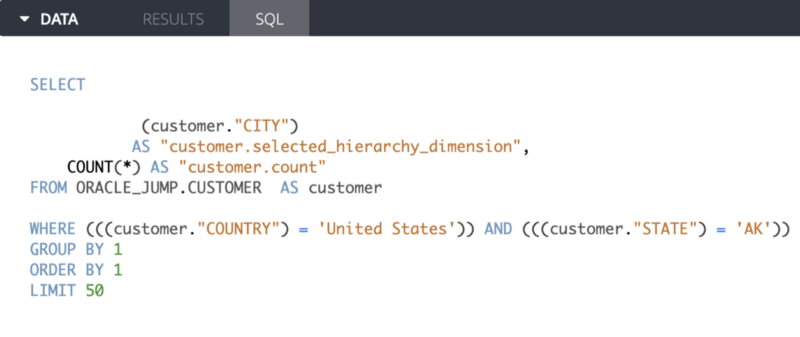
By clicking on the SQL tab, we can get a closer look at what our LookML is doing. Since customer.COUNTRY = ‘United States’ is in the query, the selected_hierarchy_dimension is using the customer.STATE in the SELECT clause. So it is following the if, else if, else structure LookML logic we defined.
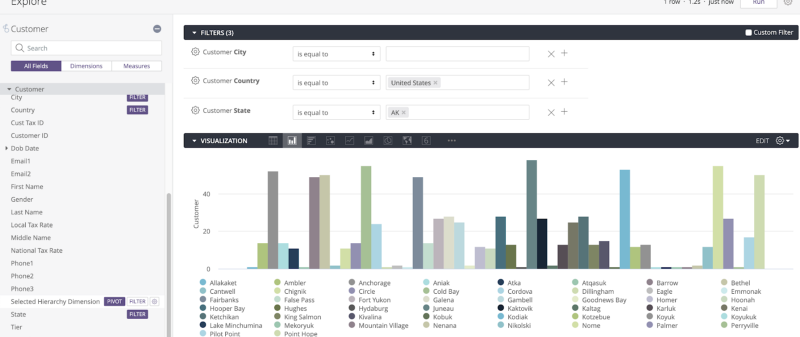
Next, we can test our dynamic visualization by populating the State Filter with AK. This should give us the Cities for State AK.
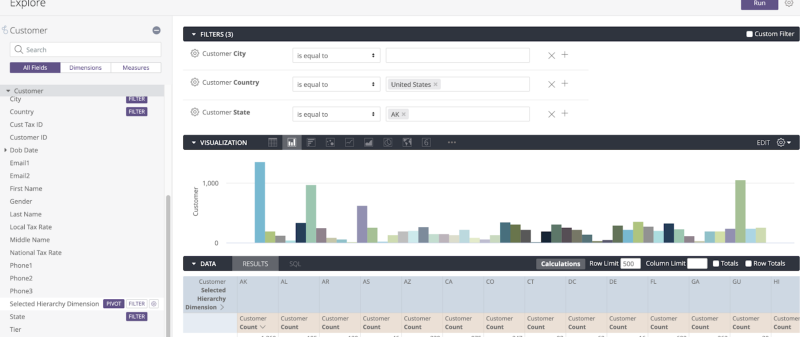
By clicking on the SQL Tab, we can take a closer look at the logic. Because we have customer.STATE = ‘AK’ in the query, the selected_hierarchy_dimension is using the customer.CITY in the SELECT clause.
Now all that is left to do is to add this Look to a Dashboard and add the applicable Dashboard Filters for a Dynamic Visualization based on the Hierarchy for Country -> State -> City.
Red Pill Analytics, an Innive Company, is a Looker Consulting Partner. From proof-of-concept to implementation to training your users, our Looker-certified consultants can help. Or, if you are interested in guidance while working with Looker, Snowflake, Fivetran, or any of your data or analytics projects, feel free to reach out to us on our website or find us on Twitter, Facebook, and LinkedIn.

3 Responses to Dynamic Looker Visualization based on Dimensional Hierarchies