
Blending Data in Oracle Analytics Cloud allows us to share additional dimensions or measures from one data set with those from another, without having to do complicated metadata modeling using RPD functionality. This is a great feature for user-sourced categorizations and can empower users to utilize Data Visualization instead of forcing them to export into desktop tools such as Excel.
It is as easy as:
- Create Project
- Add Data Sets
- Join Data Sets
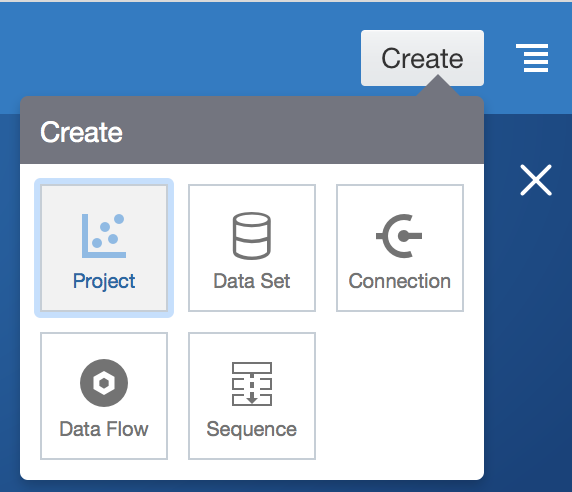
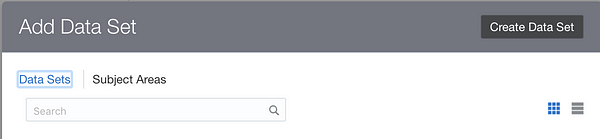
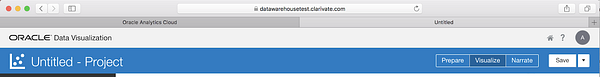
We start by creating a Project. From the Oracle DV Desktop home page click on the “Create” button, located in the top right corner of the page. From there, click on “Project.” Next, we add a new data set by clicking on “Create Data Set.”
Data Sets can be created from a File or Connection. When the Data Set is created from a File, the following need to be considered, per the Oracle product documentation:
- CSV, TXT, XLSX, XLS Data source files are accepted.
- The First Line of the excel file (Row 1 and Column 1) must be the header and the names in Row 1 must be unique.
- Row 2 onward are the data for the table and they can’t contain column names
- Data in a particular column must all be of the same datatype (text, number, etc).
- Tables must have a regular layout with no gaps or inline headings and cannot contain pivoted data.
- The excel file needs to be less than 100 MB
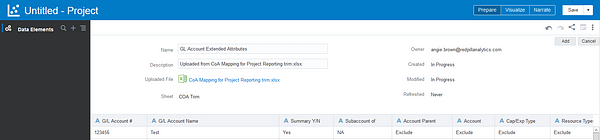
Click on “File” and select the applicable file. Make sure to update the “Name,” as this is what will be visible in Analysis, then Click “Add.”
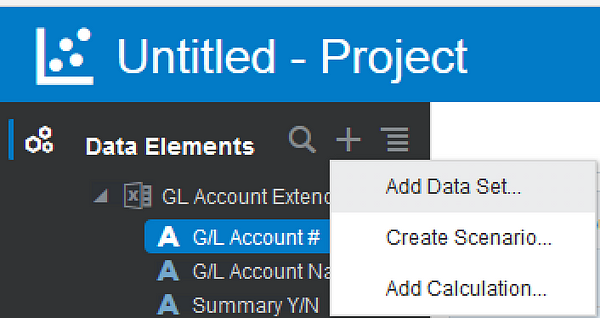
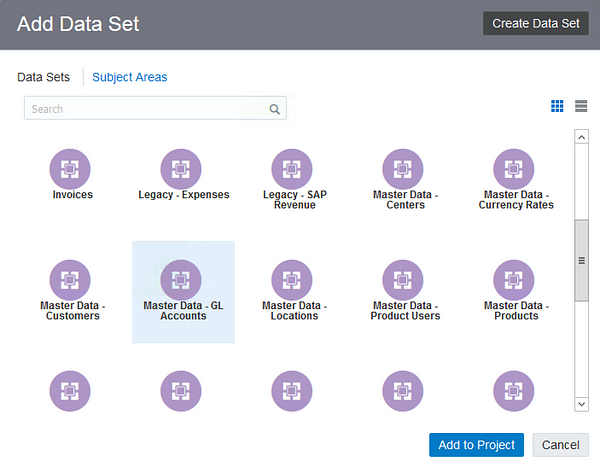
Next, we will join this new extended Data Set to an existing Subject Area Dimension. In Data Panel, on the left side, click the + button next to the “Data Elements” and then click “Add Data Set.”
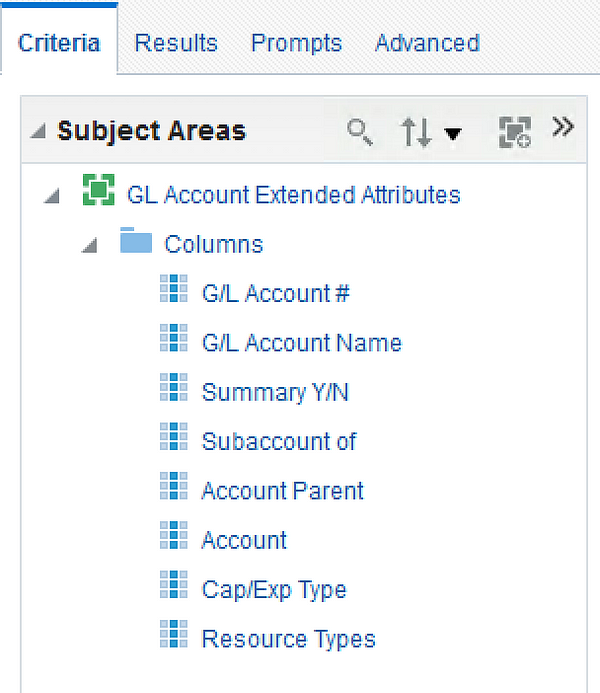
Click on the Subject Areas sub-heading and select the appropriate Subject Area, then click on “Add to Project.”
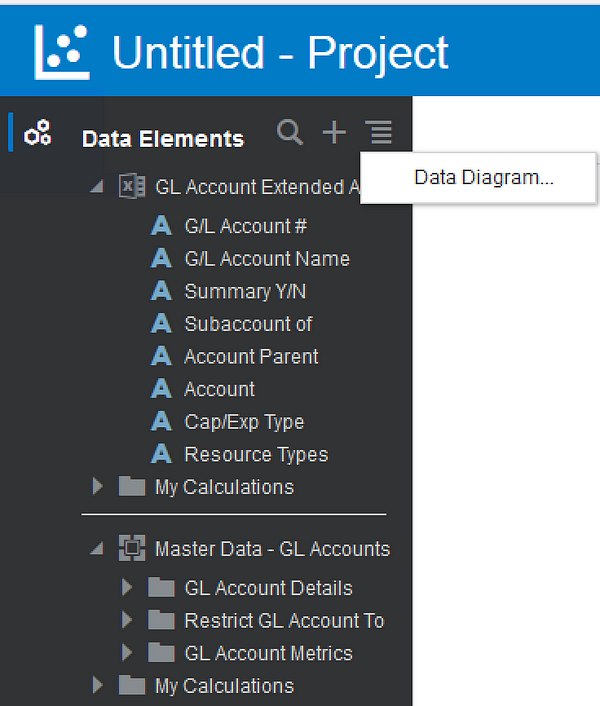
Now that we have the two Data Sets (the extended Data Set and the appropriate Subject Area Data Set) we can join them together. In the Data Panel, Click on “Data Diagram.”
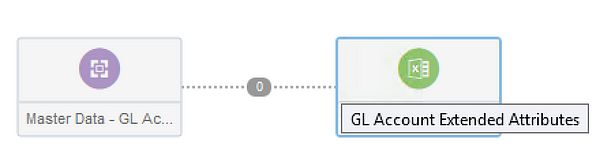
Click on the connection between the two tables to create a join. The “0” in the middle confirms no join is present yet.
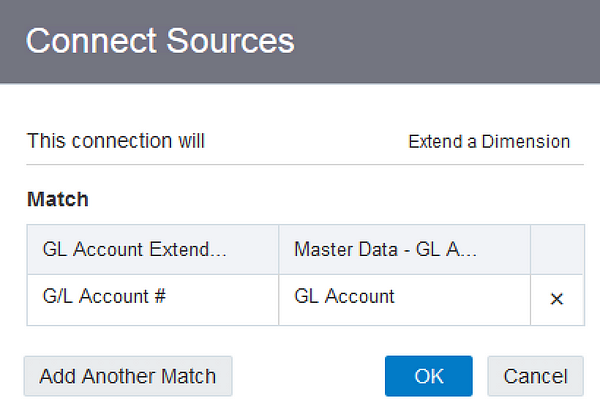
Click “Add Another Match” and select the columns from the two tables that will join them together, then click “OK.” Matches can be between one or multiple composite columns. The set of values in matched columns must be unique in the extended data source, while all other columns must be attributes.
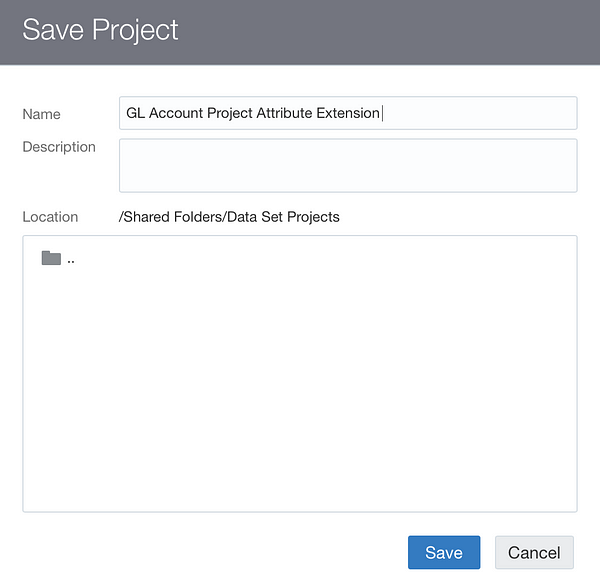
The Data Sets have been added and the joins created. The last step is to save the Project by clicking on the Save button in the top right corner.
Save the Project in the appropriate folder and — voila! — we have an External Subject Area.
To confirm the External Subject Area is available for use, log into OBI analytics. Click “New” then “Analysis” and scroll to the bottom to the new Extended Subject Area. This new extended subject area can be used in conjunction with the Subject Area used in your join.
There you have it, Extending Dimensional Attributes in OAC via Blending Data is as easy as creating a Project, adding the appropriate Data Sets, and creating the joins between the Data Sets.
Looking for guidance or data analytics strategy? From proof-of-concept to implementation to training your users, Red Pill Analytics can help. Our knowledge spans a variety of offerings across all of the major public cloud providers. Visit our website or feel free to reach out to us any time on our website or find us on Twitter, Facebook, and LinkedIn.